2003issue C111-5
Why tick breadth fails as a market personality
The exchange tick tallies names last printing higher versus lower, yet that market-breadth count is not leftover supply and a single closing print is a weak one-day forecast. A quarterly moving average and Bollinger-style bands only support a short-horizon check after they survive same-session contradictions and a split from price.
- Each tick still pairs a buyer with a seller, so the tape-wide up-versus-down count is not a direct read of leftover supply.
- Recasting the tick as a demand or sentiment gauge still leaves the closing-tick highly variable, and rare absolute extremes can appear mid-trend rather than only at a start or end.
- A 65-session moving average of the closing tick with plus-or-minus two-standard-deviation bands isolates about 4.6 percent of readings and frames those outliers only as a possible direction change over the next one to three sessions.
- Session-high and session-low ticks can both reach extremes on the same day, and their envelopes can show concurrent optimism and pessimism while related index futures fall, so the tape does not name one market personality.
Each tick still pairs a buyer with a seller
The exchange tick tallies how many names last printed higher versus lower. That market-breadth count is not a direct read of leftover supply, because each print still pairs a buyer with a seller.
An uptick can occur without shrinking available supply. That includes a buy that meets a resting sell, and a short sale that temporarily adds borrowed shares that later return to the lender.
The tick is an exchange breadth print that nets last-sale upticks against downticks. It does not report remaining supply on the book.
A closing print is a weak one-day forecast
Recasting the tick as a sentiment or demand gauge still leaves the closing print highly variable. The closing-tick, the end-of-session breadth print often treated as late-day buying or selling strength, is a weak one-day forecast.
Absolute session-extreme triggers near +1,000 or between about -800 and -900 can flag rare optimism or pessimism. Those prints also appear mid-trend rather than only at a start or end.
Deviation bands mark rare readings, not a mood
A moving average here is a fixed-lookback smoother, a roughly quarterly 65-session average applied to closing or session-extreme tick values so level and drift can be compared with price.
A 65-session moving average of the closing tick wrapped in plus-or-minus two-standard-deviation Bollinger-style bands isolates about 4.6 percent of readings. Those outliers are framed only as a possible direction change over the next one to three sessions.
Bollinger bands, as used here, are plus-or-minus one- or two-standard-deviation envelopes around that average. They mark statistically rare tick readings rather than a durable trend.
A session can print both extremes
The session-tick-range is the day's highest and lowest tick prints and their difference. It is used to test whether optimism and pessimism can coexist.
Session-high and session-low tick series, plus their difference, swing from one range edge to the other. They fail a visual stationarity check when a sloping linear fit is applied. Stationarity asks whether a plotted series wanders around a flat mean; a sloping linear fit marks a non-stationary tick path.
Extreme session-high and session-low ticks can occur on the same day. A large optimistic print does not rule out a large pessimistic print in the same session, and a single intraday extreme is an unreliable trigger.
Intradaily NYSE tick: high, net and low
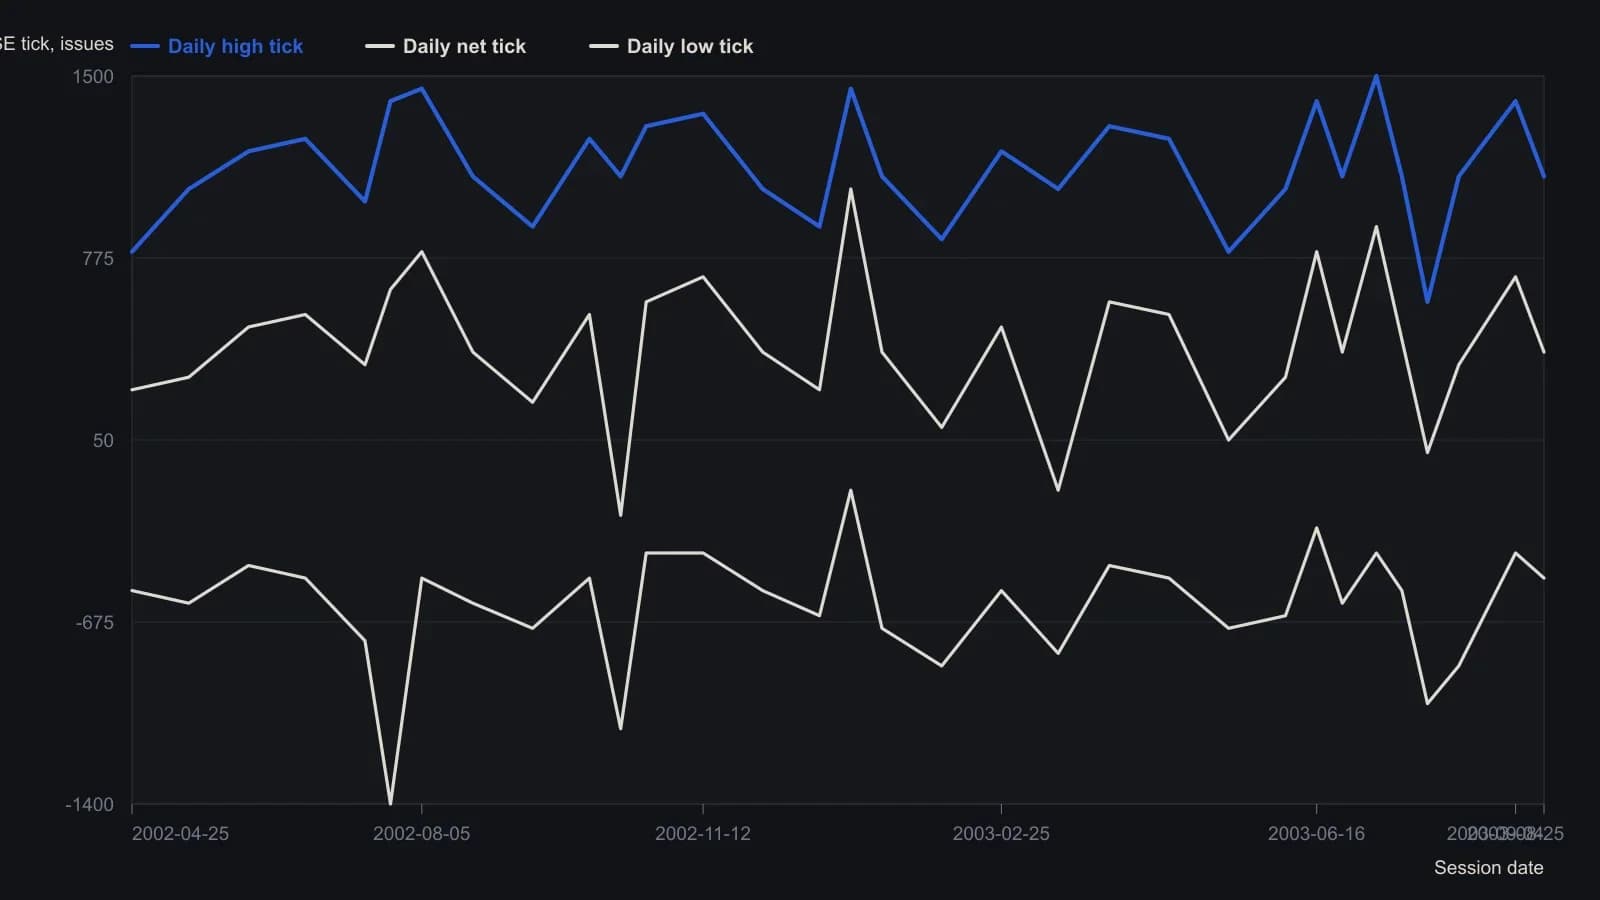
Read off the published plot, not from a table. The raster is a dense daily series, so this is a sampled trace rounded to 50 ticks and is not every session. The net series was read independently from the orange plot and is not recomputed from high minus low.
Envelopes can split while prices fall
A quarterly-length moving average of the session-high tick can rise, and its own standard-deviation width can shrink, even while the related index futures fall by 50 percent and broader price volatility rises.
In a sharp mid-2002 decline, session-low ticks became more negative while session-high ticks rose. Moving-average envelopes of the two series can show concurrent optimism and pessimism rather than one market mood.
Editorial reading: a personality story is not allowed to stand until that quarterly average and its deviation bands survive these same-session contradictions and this price-breadth split.
All readings on this track · 45 readings
- 1992Constructing volatility-scaled bands with relative strength index confirmation
- 1994Implied volatility as a band-defined regime filter for index options
- 1995Constructing projection bands from least-squares slopes
- 1995Constructing regression projection bands and range oscillators
- 1996Constructing Bollinger bands, percent-b, and stochastics
- 1996Constructing mechanical rules from Bollinger Bands and stochastics
- 1996Constructing a standard-error envelope around a linear regression
- 1996Dual-horizon ratio envelopes and regression error channels
- 1997Rational group structure with a trend screen, RSI, and bands
- 1997Asymmetric volatility band construction
- 1998Constructing three-state filters from Bollinger band envelopes
- 1999Combination filters with Bollinger Bands and the relative strength index
- 1999Constructing stochastic timed exits and band-RSI reversals
- 1999Evaluating Bollinger Bands against fixed-width and range-based envelopes
- 2000Constructing a Bollinger Band target as a forward price
- 2001Numeric candlestick encoding with local size bands
- 2001Ranked candlestick sentiment to band-cross entries
- 2002Combining Bollinger Bands, RSI, and a stop-loss
- 2002Bollinger Bands remain filters, not forecasts
- 2002Constructing a stochastic RSI with Bollinger bands
- 2002Constructing a StochRSI and Bollinger mechanical system
- 2003Constructing volatility-scaled Bollinger envelopes
- 2003Why tick breadth fails as a market personality
- 2005Constructing Bollinger bands versus fixed trading bands
- 2006Squared versus absolute deviation in envelope construction
- 2006Confirming yen crossovers with implied volatility and bands
- 2006A daily candle reversal is a hypothesis until shorter sessions fail at the same zone
- 2008Rebuild the Relative Strength Index as price-scale bands
- 2008Reading Relative Strength Index extremes on one price axis with Bollinger Bands and moving averages
- 2011Three-filter confirmation for short-swing futures
- 2011Constructing an inverse Fisher stochastic with bands and averages
- 2012Constructing a Bollinger Band indicator suite
- 2012Stacking price extremes, crossovers, bands, and MACD
- 2012Adaptive Bollinger band impulse, trend, and momentum filters
- 2013Rescaling stochastic, percent-B, and wave-count parameters
- 2014Industry-group quartile pivots as a Bollinger Bands case study
- 2014Bollinger Bands as adaptive price envelopes: a 2014 classroom case
- 2016Trend-channel entry rules from stacked moving averages
- 2016A permission stack for Bollinger, RSI, and the 50-period average
- 2017Constructing weighted Bollinger bands and volume averages
- 2017Four swing-entry rules that share a timed exit
- 2017Two-wave monthly cycles as a regime filter
- 2019Constructing exponential-deviation-bands from a midline-average
- 2020Critiquing exponential variants of Bollinger Bands
- 2020Constructing selectable volatility and moving-average bands