2011issue C1277-79
Constructing an inverse Fisher stochastic with bands and averages
This archive article presents a construction pipeline that first smooths price, then bounds a stochastic with an inverse Fisher transform, and keeps moving averages and Bollinger Bands as independent confirmation layers.
- Smooth price first by leaving the number of rainbow-average iterations as a free parameter, then compute the stochastic on that iteratively smoothed series rather than the raw close.
- Apply an inverse Fisher transform so the oscillator is compressed toward the extremes of a bounded range.
- Keep Bollinger Bands and 20-day, 50-day, and 100-day simple moving averages as separate confirmation layers rather than substitutes for the oscillator.
- Search for a supporting filter, such as a declining-market gate, alongside the core oscillator instead of replacing it.
What the construction separates
The archive construction applies an inverse Fisher transform to a stochastic oscillator whose input is iteratively smoothed price rather than the raw close.
Editorial reading: treat that sequence as a pipeline with separate jobs. Smooth the price series first. Bound the stochastic second. Keep moving averages and Bollinger Bands as independent confirmation layers so each layer has a limited decision.
Smoothing as a free stage
The smoothing stage can be specified so that the number of successive rainbow-average iterations is a free parameter rather than a fixed count.
A rainbow-average iteration is a repeated smoothing pass in which each stage averages the previous stage before the stochastic is computed.
Bounding the oscillator
After that smoothing, the inverse-fisher-stochastic is the stochastic oscillator whose iteratively smoothed price input is passed through an inverse Fisher transform so the output is compressed toward the extremes of a bounded range.
The same construction was packaged both as a standalone oscillator and as an automated strategy that consumes that oscillator.
Inverse Fisher stochastic versus the unsquashed 30,5 stochastic on daily S&P 500
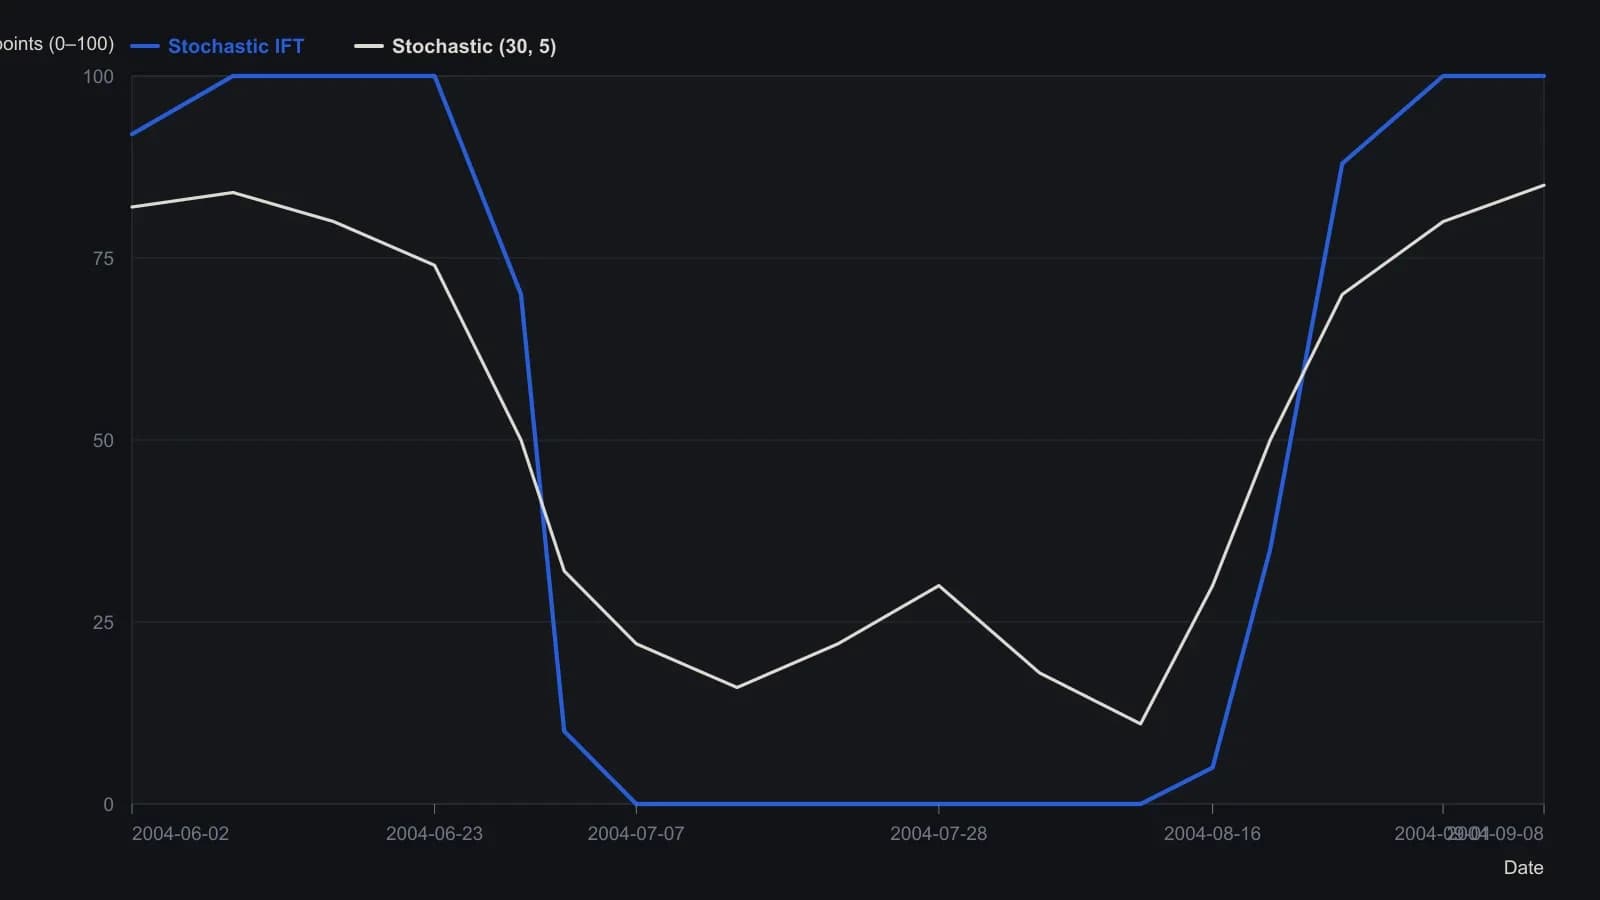
Pane label is Stochastic (30, 5) and Stochastic IFT. Values are approximate readings from the magazine raster, honest to about five oscillator points. The screenshot is dated 11 October 2011; the visible June–September window and the 1060–1150 index scale match the summer 2004 S&P 500 path named in the Updata note.
Independent confirmation layers
A spreadsheet reconstruction places Bollinger Bands, a conventional stochastic, and the inverse-Fisher stochastic in one calculation set.
Bollinger Bands are used here as a separate confirmation layer rather than as a substitute for the oscillator.
That reconstruction also plots 20-day, 50-day, and 100-day simple moving averages of the close beside the oscillator stack. Each simple-moving-average is an equal-weighted average of closing prices over a fixed lookback.
Rules that sit beside the oscillator
The published rule set was used to drive a simple transaction-level simulation of entries and exits.
Complementary rules, including a filter intended to block signals in a declining market, were searched for alongside the core oscillator rather than replacing it.
A supporting-filter is an extra rule, such as a declining-market gate, that can suppress oscillator signals instead of replacing the oscillator itself.
Worked series
Worked examples applied the oscillator to a daily equity-index series and to an hourly currency pair.
All readings on this track · 45 readings
- 1992Constructing volatility-scaled bands with relative strength index confirmation
- 1994Implied volatility as a band-defined regime filter for index options
- 1995Constructing projection bands from least-squares slopes
- 1995Constructing regression projection bands and range oscillators
- 1996Constructing Bollinger bands, percent-b, and stochastics
- 1996Constructing mechanical rules from Bollinger Bands and stochastics
- 1996Constructing a standard-error envelope around a linear regression
- 1996Dual-horizon ratio envelopes and regression error channels
- 1997Rational group structure with a trend screen, RSI, and bands
- 1997Asymmetric volatility band construction
- 1998Constructing three-state filters from Bollinger band envelopes
- 1999Combination filters with Bollinger Bands and the relative strength index
- 1999Constructing stochastic timed exits and band-RSI reversals
- 1999Evaluating Bollinger Bands against fixed-width and range-based envelopes
- 2000Constructing a Bollinger Band target as a forward price
- 2001Numeric candlestick encoding with local size bands
- 2001Ranked candlestick sentiment to band-cross entries
- 2002Combining Bollinger Bands, RSI, and a stop-loss
- 2002Bollinger Bands remain filters, not forecasts
- 2002Constructing a stochastic RSI with Bollinger bands
- 2002Constructing a StochRSI and Bollinger mechanical system
- 2003Constructing volatility-scaled Bollinger envelopes
- 2003Why tick breadth fails as a market personality
- 2005Constructing Bollinger bands versus fixed trading bands
- 2006Squared versus absolute deviation in envelope construction
- 2006Confirming yen crossovers with implied volatility and bands
- 2006A daily candle reversal is a hypothesis until shorter sessions fail at the same zone
- 2008Rebuild the Relative Strength Index as price-scale bands
- 2008Reading Relative Strength Index extremes on one price axis with Bollinger Bands and moving averages
- 2011Three-filter confirmation for short-swing futures
- 2011Constructing an inverse Fisher stochastic with bands and averages
- 2012Constructing a Bollinger Band indicator suite
- 2012Stacking price extremes, crossovers, bands, and MACD
- 2012Adaptive Bollinger band impulse, trend, and momentum filters
- 2013Rescaling stochastic, percent-B, and wave-count parameters
- 2014Industry-group quartile pivots as a Bollinger Bands case study
- 2014Bollinger Bands as adaptive price envelopes: a 2014 classroom case
- 2016Trend-channel entry rules from stacked moving averages
- 2016A permission stack for Bollinger, RSI, and the 50-period average
- 2017Constructing weighted Bollinger bands and volume averages
- 2017Four swing-entry rules that share a timed exit
- 2017Two-wave monthly cycles as a regime filter
- 2019Constructing exponential-deviation-bands from a midline-average
- 2020Critiquing exponential variants of Bollinger Bands
- 2020Constructing selectable volatility and moving-average bands