2001issue C121-6
Two tests of a rate-adjusted earnings-yield gap
First show why a drifting stock-versus-bond yield gap is a weak raw forecast. Then rank the same rate-adjusted spread inside a 36-month lookback, so the test is whether the current gap is extreme versus its own recent range, not versus a once-and-for-all cutoff.
- A rate-adjusted spread subtracts the contemporaneous 10-year Treasury yield from the earnings yield and is only a crude stock-versus-bond comparison.
- A fixed yield-gap cutoff can stay crossed after the series drifts, and quartile splits of the raw spread were not a consistent next-year filter in the historical sample.
- A 36-month stochastic oscillator ranks the latest spread inside its own lookback window, printing 100 at a three-year high and 0 at a three-year low.
- Editorial reading: the fairer test asks whether the current gap is extreme versus its recent range, then checks later nonoverlapping 12-month index changes at those overbought-oversold prints.
Two questions, one series
The earnings yield is trailing twelve-month index earnings divided by the index level, expressed as a percentage. Subtracting the contemporaneous 10-year Treasury yield produces a rate-adjusted spread, used as a crude stock-versus-bond comparison.
That series can be evaluated in two steps. The first step asks whether the raw gap itself is a usable forecast. The second step ranks the latest gap inside a fixed lookback window and asks only whether it is extreme versus its own recent range.
Why the raw spread is a weak forecast
A fixed dividend-yield-versus-bond-yield cutoff that held before 1959 stayed crossed afterward. An absolute earnings-yield exit in the early 1990s would have left the later advance outside the rule.
From April 1953 through March 2001 the earnings-yield minus 10-year Treasury spread ranged from -4.2% to 7.8% with a median of -0.37%. The earnings yield had not been above the 10-year yield since September 1980.
Four equal 140-month quartiles of the raw spread produced next-12-month total returns of 14.4%, 16.1%, 6.0%, and 20.2%. The un-normalized difference was not a consistent forward filter in that sample.
A 36-month ranking of the same series
A 36-month stochastic oscillator ranks the latest earnings-yield minus 10-year Treasury spread inside its own three-year lookback window. It prints 100 at a three-year high of that spread and 0 at a three-year low. Those prints are the overbought-oversold marks for this input.
The oscillator is a 0 to 100 ranking of the latest observation inside a fixed lookback. Here the input is the rate-adjusted earnings-yield spread rather than price.
From May 1956 through March 2001 the 36-month stochastic averaged 41 with a median of 33.2. The next-12-month total return was 3.9% in the lowest decile and 5.3% when the reading was below 10.6.
Next-year S&P 500 return after a 36-month rank of the yield gap
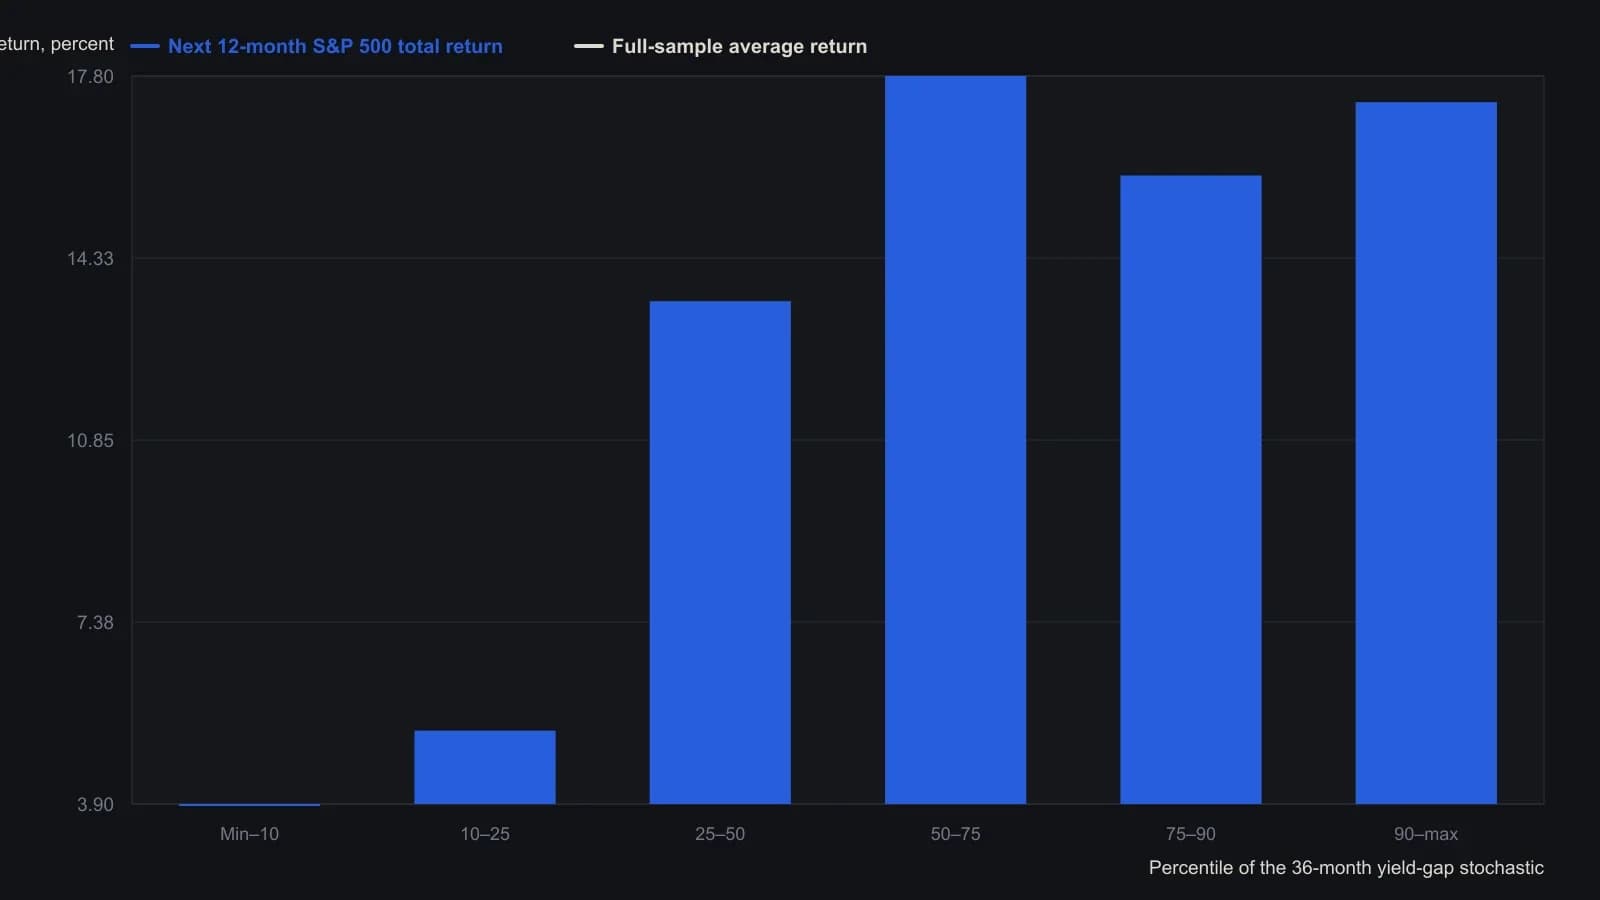
Lookback is 36 months on trailing-12-month S&P 500 earnings yield minus the 10-year Treasury yield. Subsequent returns include dividends. The min–10 and 10–25 bands both start at a stochastic of 0 because many months sat on the three-year floor.
Extreme prints and nonoverlapping holds
In nine nonoverlapping cases since 1953 when the stochastic printed 100, the following 12-month index change had a median of 18.4% and a mean of 12.4%, and the index was higher in seven of the nine cases. A nonoverlapping hold is a later 12-month outcome window that does not share months with the next extreme-signal test.
In 16 months when the stochastic printed 0, the next 12-month index change had a median of -2.7% and a mean of 1.5%, with a decline in eight of those 16 years. The last three late-1990s zeros were not reliable inside a single 12-month window.
A January 2000 reading of 100 was followed by a -2.0% 12-month index change, and at the March 2000 peak the oscillator stood at 7 with a 22.6% decline over the next 12 months.
All readings on this track · 42 readings
- 1987Stochastic fast and slow construction as a rebuildable stack
- 1989Building the stochastic oscillator from close location
- 1990Monthly stochastics as a multi-year bond regime filter
- 1990Walk-forward screen for yen indicator rules
- 1990Slow stochastic construction for index pullback entries
- 1991Random Walk Index construction with an adaptive lookback
- 1991Building a two-stage stochastic oscillator from close location
- 1992Constructing fast and slow stochastic oscillator lines
- 1992Constructing nested stochastic lookbacks
- 1994Construct the four-state price-volume rank before filtering it
- 1996Crowded stochastics, false breakouts, and hidden stops
- 1997Fade and follow entries from stochastic extremes
- 1998Oversold confirmation as a staged rule-based-entry case
- 1999Constructing regular and slow stochastic oscillators
- 2001Construct a variable-interval simple moving average from stacked extremes
- 2001Threshold RSI and stochastic setups with next-bar stops
- 2001Two tests of a rate-adjusted earnings-yield gap
- 2002Constructing a two-line stochastic from a range-normalized close
- 2002Inspect mechanical stochastic daytrade rules on one bar
- 2003Constructing an adaptive stochastic RSI
- 2003Four parameters that construct a stochastic oscillator
- 2004Volume breakout as signal, pullback as entry
- 2004A first currency-market checklist with two averages and a slow stochastic
- 2005Shared-scale cycle indexes with companion oscillators
- 2005Current-bar versus prior-bar range construction for the stochastic oscillator
- 2005Two-session moving-average pullback short
- 2006Market condition as a permission layer for moving averages and oscillators
- 2008Lock the stop at support before sizing a stochastic entry
- 2010Construct a center-line volume oscillator and read it with a stochastic oscillator
- 2010Sharpened RSI turns with rainbow averages and a slow stochastic
- 2011Build a Spearman rank oscillator from ordered closes
- 2012Gold as a regime-dependent hedge in the euro-area crisis
- 2012Pairing moving averages with variable-length stochastics
- 2014Two-leg stochastic stress oscillator as a rebuild drill
- 2014Ingress dates as price bases for relative strength, stochastics, and moving averages
- 2017Constructing a dual EMA stochastic from range normalization
- 2018Constructing a two-stage stochastic RSI for comparable price-oscillator divergences
- 2018Combining a weekly stochastic, a long moving average, and two-day resistance
- 2018Weekly and daily stochastic readings with a long moving average and support
- 2018A confirming workflow for rotating from discretionary to staples
- 2019Stochastic scan thresholds, averages, and formula syntax
- 2020Constructing Slow %K as a two-stage helper