2004issue C111-4
Volume breakout as signal, pullback as entry
A 2004 chart workflow treated a volume-backed range break as evidence that buyers had seized the tape, then deferred the candidate fill to a later pullback, range retest, or stochastic trough divergence.
- An extended horizontal consolidation with a shrinking range and falling volatility is the chart condition used to frame a later breakout hypothesis.
- A volume-backed breakout can be logged as evidence that the market is ready to move, while the candidate entry waits for a post-breakout-pullback toward the vacated range.
- Expeditors International gapped through a winter 37-40 band on two-month-high volume, then reversed back through the range and under 36, a failed-hold after the first thrust.
- Swing-timing begins looking for a long two sessions after a swing high, or a short two sessions after a swing low, instead of entering on the extreme print.
Two gates, not one fill
The archive workflow used a two-gate entry. An extended horizontal consolidation with a shrinking range and falling volatility framed a later breakout hypothesis. A breakout was a thrust or close that left that well-defined range and was treated as a signal that the prior range may have ended.
Volume-price-analysis then checked whether the breakout print came with unusually heavy volume, as evidence of urgent participation. That volume-backed breakout could be logged as evidence that the market was ready to move. The candidate entry was deferred to a later post-breakout-pullback toward the vacated range.
Choice Hotels and the delayed fill
Choice Hotels left a July trading range on 29 July with a roughly three-dollar advance on above-average volume, then reversed. A later candidate entry appeared about 10 to 11 sessions after the first thrust.
After an intraday extreme near 54, Choice Hotels was lower on eight of the next nine sessions and later found a shelf at the 50-day exponential moving average. A fill near 53 at the breakout close sat through that multi-session fade.
Carpenter Technology after the range
Carpenter Technology left a three-week late-July consolidation from near 34 to near 37 and then printed four additional higher sessions to a close near 43. The archive records that continuation after the range was vacated.
Editorial note: TradersWeek does not read the Carpenter Technology follow-through as a reason to fill on the breakout close. The first gate still only certifies that the range may have ended.
A failed-hold after a volume gap
Expeditors International spent the winter in a 37-40 band that often tightened to 37-39, gapped through that ceiling in February 2004 on two-month-high volume, then reversed back through the range and traded under 36 by mid-March. That sequence is a failed-hold: the breakout left the old ceiling, then slipped back through the range and undercut the floor.
From late February to mid-March, successively lower price troughs against successively higher stochastic troughs were treated as a positive divergence that could confirm buyer control after the earlier volume breakout. The stochastic-oscillator was read as a bounded oscillator whose successively higher troughs against lower price troughs mark that divergence.
Editorial note: TradersWeek reads the Expeditors International tape as the reason the second gate exists. A volume-backed breakout can still fail to hold. A later pullback, retest, or stochastic trough divergence is where the workflow looks for buyer control after the first thrust has been observed.
Swing-timing away from the extreme
A swing-timing rule begins looking for a long two sessions after a swing high, or a short two sessions after a swing low, instead of entering on the extreme print.
Editorial note: TradersWeek reads that delay as the same idea as the post-breakout-pullback. The first thrust, or the extreme bar, is not treated as the fill.
EXPD daily price versus the $37–$40 range
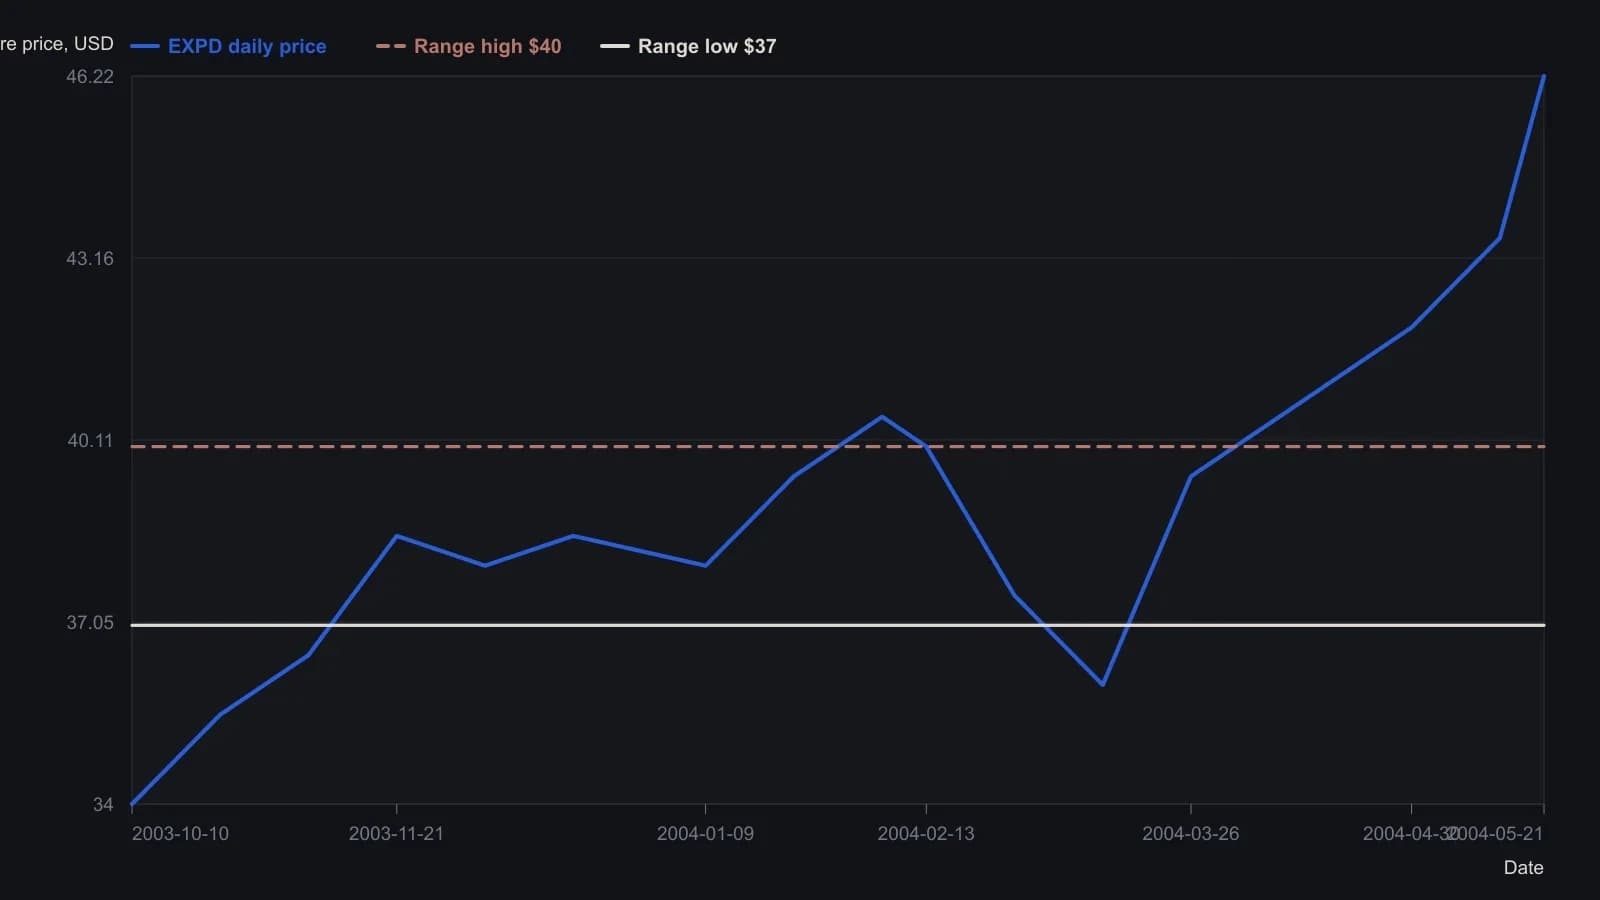
Horizontal $37 and $40 lines are the range named in the text, not a fit to the image. Intermediate weekly closes are approximate readings against the printed dollar scale, not official OHLC.
All readings on this track · 42 readings
- 1987Stochastic fast and slow construction as a rebuildable stack
- 1989Building the stochastic oscillator from close location
- 1990Monthly stochastics as a multi-year bond regime filter
- 1990Walk-forward screen for yen indicator rules
- 1990Slow stochastic construction for index pullback entries
- 1991Random Walk Index construction with an adaptive lookback
- 1991Building a two-stage stochastic oscillator from close location
- 1992Constructing fast and slow stochastic oscillator lines
- 1992Constructing nested stochastic lookbacks
- 1994Construct the four-state price-volume rank before filtering it
- 1996Crowded stochastics, false breakouts, and hidden stops
- 1997Fade and follow entries from stochastic extremes
- 1998Oversold confirmation as a staged rule-based-entry case
- 1999Constructing regular and slow stochastic oscillators
- 2001Construct a variable-interval simple moving average from stacked extremes
- 2001Threshold RSI and stochastic setups with next-bar stops
- 2001Two tests of a rate-adjusted earnings-yield gap
- 2002Constructing a two-line stochastic from a range-normalized close
- 2002Inspect mechanical stochastic daytrade rules on one bar
- 2003Constructing an adaptive stochastic RSI
- 2003Four parameters that construct a stochastic oscillator
- 2004Volume breakout as signal, pullback as entry
- 2004A first currency-market checklist with two averages and a slow stochastic
- 2005Shared-scale cycle indexes with companion oscillators
- 2005Current-bar versus prior-bar range construction for the stochastic oscillator
- 2005Two-session moving-average pullback short
- 2006Market condition as a permission layer for moving averages and oscillators
- 2008Lock the stop at support before sizing a stochastic entry
- 2010Construct a center-line volume oscillator and read it with a stochastic oscillator
- 2010Sharpened RSI turns with rainbow averages and a slow stochastic
- 2011Build a Spearman rank oscillator from ordered closes
- 2012Gold as a regime-dependent hedge in the euro-area crisis
- 2012Pairing moving averages with variable-length stochastics
- 2014Two-leg stochastic stress oscillator as a rebuild drill
- 2014Ingress dates as price bases for relative strength, stochastics, and moving averages
- 2017Constructing a dual EMA stochastic from range normalization
- 2018Constructing a two-stage stochastic RSI for comparable price-oscillator divergences
- 2018Combining a weekly stochastic, a long moving average, and two-day resistance
- 2018Weekly and daily stochastic readings with a long moving average and support
- 2018A confirming workflow for rotating from discretionary to staples
- 2019Stochastic scan thresholds, averages, and formula syntax
- 2020Constructing Slow %K as a two-stage helper