2002issue C021-2
Constructing a two-line stochastic from a range-normalized close
The latest close is scaled inside a chosen lookback high-low window and drawn as percent K. A short smoother becomes percent D, and three reading conventions follow from those two lines without turning the drawing into a trading plan.
- Percent K locates the latest close inside the lookback high-low span and scales that location by 100.
- Percent D smooths percent K, commonly over three periods, and is also stated as 100 times a three-period high-low ratio labeled H3/L3.
- The two-line drawing supports three conventions: a threshold recross of the 20 or 80 band, a line cross of percent K through percent D, and a divergence when price and the oscillator split.
- Successive readings can move erratically and generate false signals, so the oscillator is presented as better read alongside other indicators.
A close inside a lookback range
A stochastic oscillator locates the latest close inside the high-low span of a chosen lookback and scales that location by 100. That step is range normalization: the close is mapped onto a 0-100 scale by dividing its distance from the lookback low by the lookback high-low span.
Percent K is the primary line. It is the close minus the n-period lowest low, divided by the n-period high-low span, then multiplied by 100. The lookback is the n-period window that supplies the highest high and lowest low used in that ratio. The lookback n is suggested between 5 and 21 periods while remaining free to take any length.
A second line that smooths percent K
The construction is drawn as two series: a primary percent K line and a secondary percent D line that smooths percent K, commonly over three periods.
The percent D construction is stated as 100 times a three-period high-low ratio labeled H3/L3.
Three reading conventions
One interpretive convention treats a move of either line below 20 and then back above 20, or above 80 and then back below 80, as opposite threshold events. That pattern is a threshold recross: a reading that first leaves a fixed band such as 20 or 80 and then re-enters it.
A second convention treats a percent K cross through percent D from below or from above as opposite line-cross events. A line cross is an event in which the primary line moves through the smoother.
A third convention labels a price advance the oscillator does not confirm as a negative divergence, and a price decline the oscillator does not confirm as the opposite divergence. Divergence is a split in direction between price and the oscillator.
Two-line stochastic on Sprint FON, November 2000–April 2001
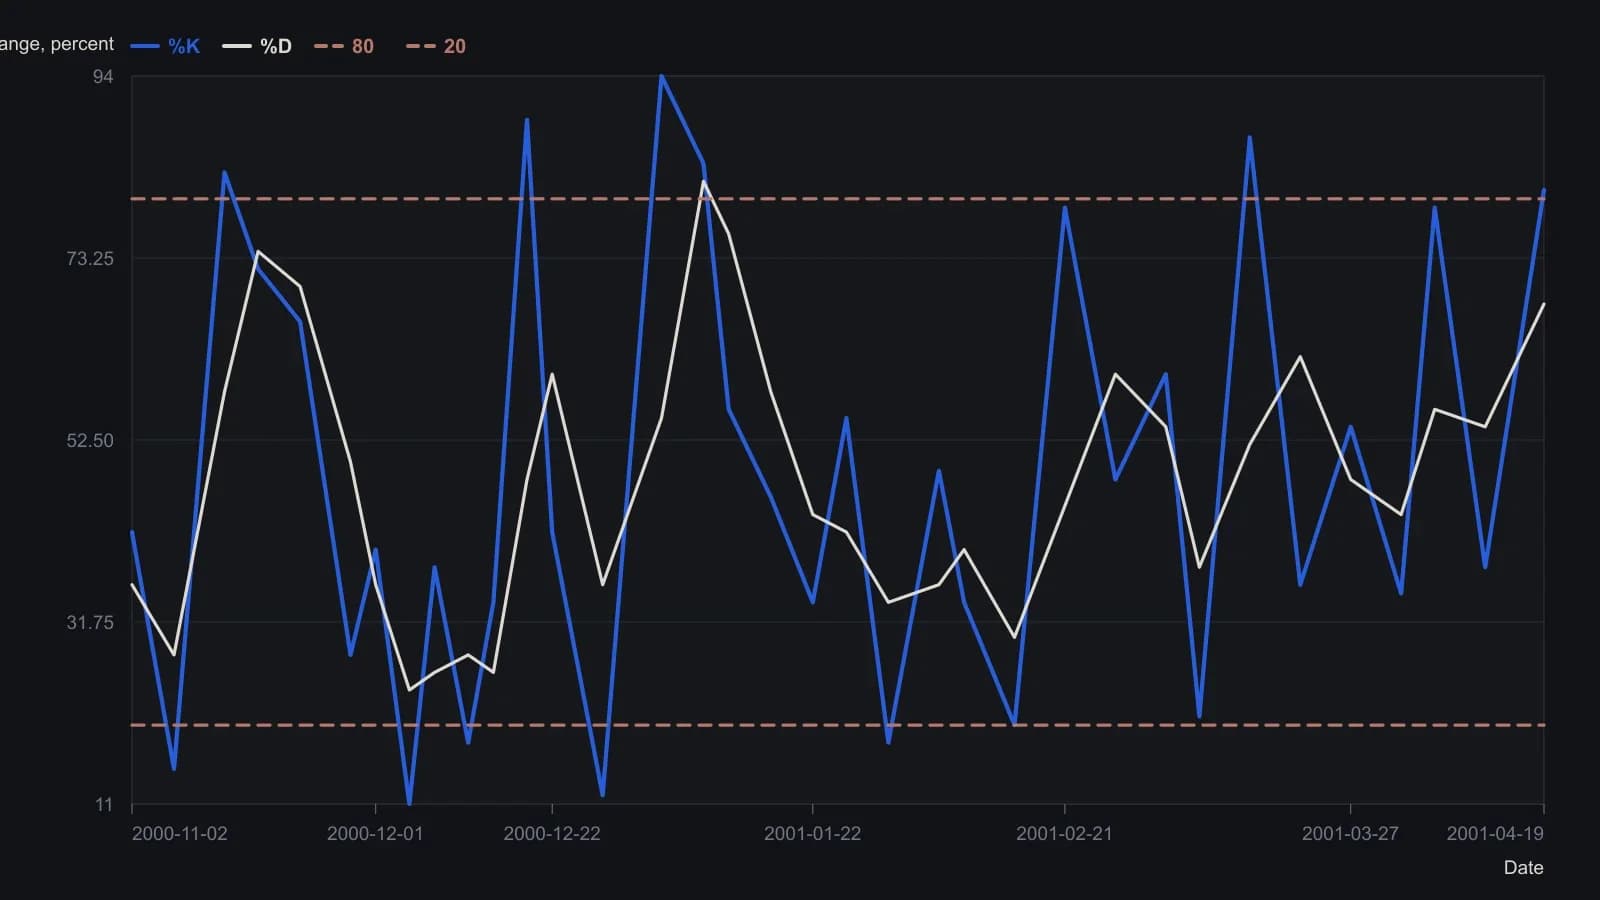
The oscillator pane has no printed vertical scale. The two horizontal guides are the 20 and 80 levels named in the article and sit at the usual fifths of a 0–100 stochastic. Digitized readings are approximate to a few percent. Lookback n is not labeled on the figure; the article suggests 5–21 periods and a three-period percent D.
Why the oscillator is not read alone
Because successive readings can move erratically and generate false signals, the oscillator is presented as better read alongside other indicators. Editorial: the three conventions are treated here as grammars that fall out of the two-line design, not as entry or exit rules.
All readings on this track · 42 readings
- 1987Stochastic fast and slow construction as a rebuildable stack
- 1989Building the stochastic oscillator from close location
- 1990Monthly stochastics as a multi-year bond regime filter
- 1990Walk-forward screen for yen indicator rules
- 1990Slow stochastic construction for index pullback entries
- 1991Random Walk Index construction with an adaptive lookback
- 1991Building a two-stage stochastic oscillator from close location
- 1992Constructing fast and slow stochastic oscillator lines
- 1992Constructing nested stochastic lookbacks
- 1994Construct the four-state price-volume rank before filtering it
- 1996Crowded stochastics, false breakouts, and hidden stops
- 1997Fade and follow entries from stochastic extremes
- 1998Oversold confirmation as a staged rule-based-entry case
- 1999Constructing regular and slow stochastic oscillators
- 2001Construct a variable-interval simple moving average from stacked extremes
- 2001Threshold RSI and stochastic setups with next-bar stops
- 2001Two tests of a rate-adjusted earnings-yield gap
- 2002Constructing a two-line stochastic from a range-normalized close
- 2002Inspect mechanical stochastic daytrade rules on one bar
- 2003Constructing an adaptive stochastic RSI
- 2003Four parameters that construct a stochastic oscillator
- 2004Volume breakout as signal, pullback as entry
- 2004A first currency-market checklist with two averages and a slow stochastic
- 2005Shared-scale cycle indexes with companion oscillators
- 2005Current-bar versus prior-bar range construction for the stochastic oscillator
- 2005Two-session moving-average pullback short
- 2006Market condition as a permission layer for moving averages and oscillators
- 2008Lock the stop at support before sizing a stochastic entry
- 2010Construct a center-line volume oscillator and read it with a stochastic oscillator
- 2010Sharpened RSI turns with rainbow averages and a slow stochastic
- 2011Build a Spearman rank oscillator from ordered closes
- 2012Gold as a regime-dependent hedge in the euro-area crisis
- 2012Pairing moving averages with variable-length stochastics
- 2014Two-leg stochastic stress oscillator as a rebuild drill
- 2014Ingress dates as price bases for relative strength, stochastics, and moving averages
- 2017Constructing a dual EMA stochastic from range normalization
- 2018Constructing a two-stage stochastic RSI for comparable price-oscillator divergences
- 2018Combining a weekly stochastic, a long moving average, and two-day resistance
- 2018Weekly and daily stochastic readings with a long moving average and support
- 2018A confirming workflow for rotating from discretionary to staples
- 2019Stochastic scan thresholds, averages, and formula syntax
- 2020Constructing Slow %K as a two-stage helper