1986issue C051-6
Auditing stochastic crossovers with moving-average baselines
A historical audit locked one stochastic-oscillator recipe, applied a transaction-cost load on a volatility-scaled book, and asked whether that four-parameter crossover still looked useful next to a plain price moving-average crossover scored with Sharpe ratio.
- The stochastic oscillator was defined as the close’s place inside the high-low range of a stated lookback and was treated as valid on any regular bar length, not only daily samples.
- The tested rule reversed a long or short book only after a shorter average of that reading crossed a longer average and then held the new side for a confirmation count.
- After a stated transaction-cost load, fast dual averages were described as a drain, slower smoothers looked stronger inside the family, and a non-optimized 10/30-day price moving-average crossover ranked higher on Sharpe ratio and a gain-to-retracement score.
- The testers limited the verdict to this crossover recipe looking poor to mediocre and warned against treating the measure as useful before the intended application is tested historically.
The reading that was locked
The stochastic oscillator was specified as a scaled reading of where the latest close sits inside the high-low range of the prior N bars. High values sit near the range top and low values sit near the range floor. The testers treated that reading as valid on any regular sampling interval, not only daily bars.
The crossover that could reverse the book
The evaluated rule did not reverse on the raw reading. A long or short position flipped only after a shorter moving average of the stochastic oscillator crossed a longer moving average and then remained on the new side for a stated confirmation count.
The search used four integers: the range length, the short and long smoothers of the stochastic oscillator, and the confirmation count. The same structure was run on both daily and weekly samples.
A volatility-scaled book and a transaction-cost load
The historical simulation used a large hypothetical multi-market book so contract counts could be scaled to volatility differences rather than holding one contract in every market. That design is a volatility-scaled book: quieter and wilder markets do not enter the simulation at equal unit size.
Each simulated round turn was charged 150 units as a transaction-cost load meant to stand in for commission plus typical entry and exit slippage, not commission alone. The testers argued that a charge of at least 100 units was already a reasonable floor.
What the daily and weekly search showed
Over the 1976-1984 window, six of sixteen weekly parameter sets finished with a loss. Sixteen of twenty-two daily sets finished with a gain that the testers still described as mediocre in most cases.
The strongest stochastic-oscillator sets used much slower smoothers than the commonly advertised very short dual averages. Combinations that stayed similarly fast were described as a persistent drain once the transaction-cost load was included. Fading those fast signals was also said to fail under the same cost load.
A plain price crossover as the comparison family
A non-optimized 10/30-day price moving-average crossover was presented as the stronger family in a like-for-like parameter scatter. Sharpe ratio and a gain-to-retracement ratio were the comparison scores, so ranking did not rest on raw gain alone.
Editorial comment: a searched four-integer grid leaves a parameter-hindsight gap between the single best lookback combination found after the test and the result a trader would have obtained without knowing that combination in advance. The unfitted price crossover is the foil that keeps that gap in view.
Daily 1:3 moving-average crossover returns, 1976–1984
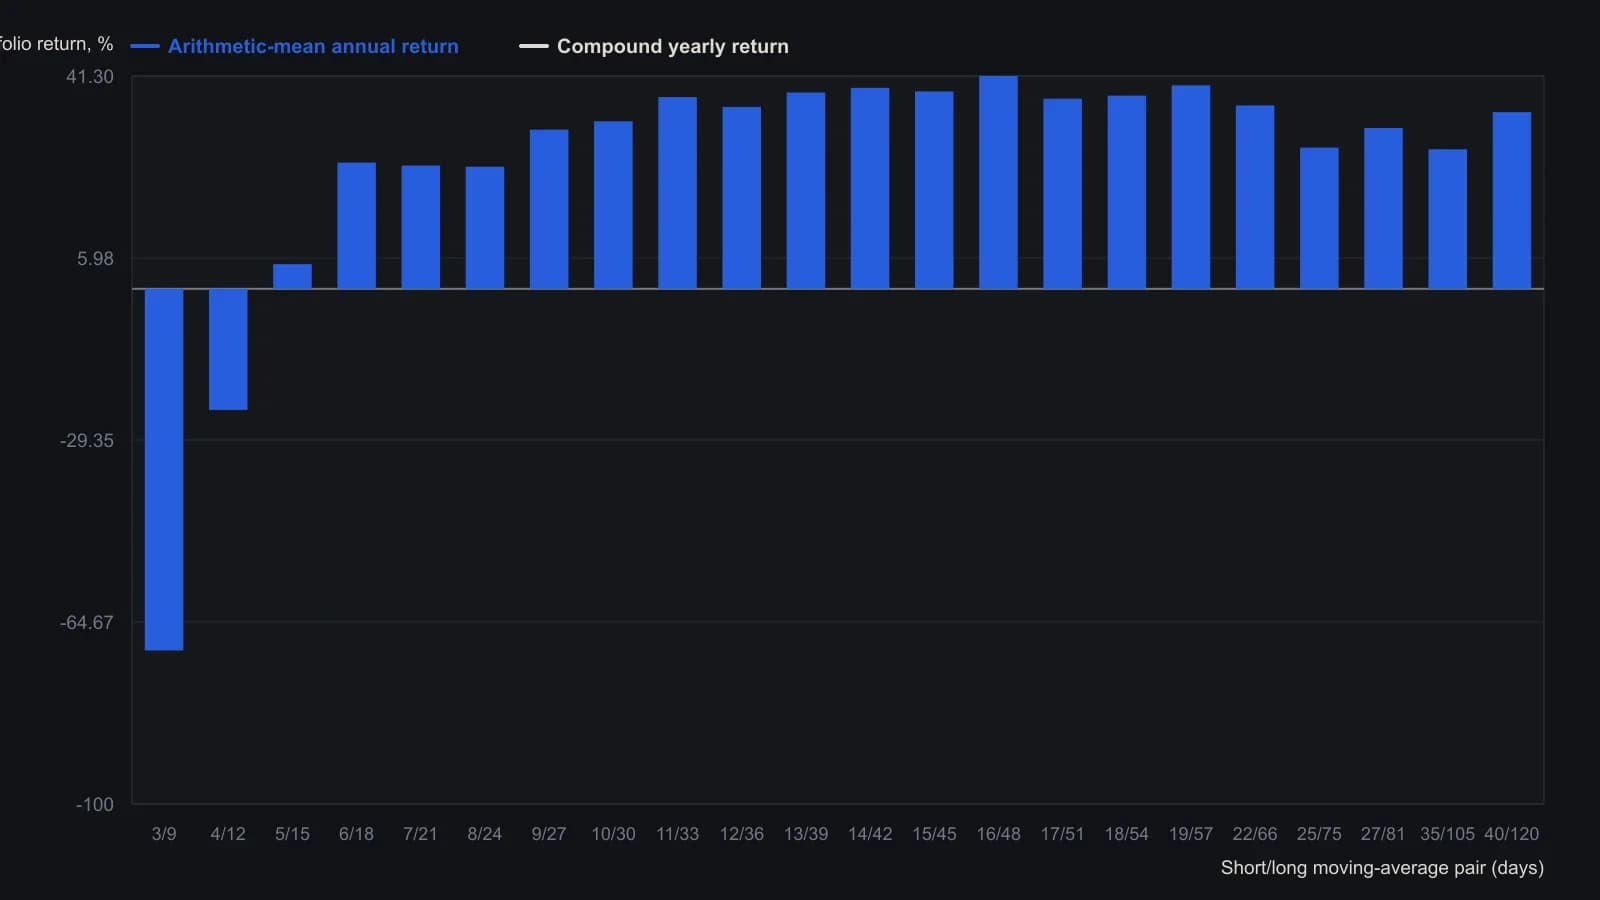
Every pair keeps a fixed 1:3 short-to-long day count. Simulations charged $150 per trade on a 25-commodity, volatility-scaled $1.3 million book over 1976–1984. The 10/30 pair is the one the article quotes (32.5% arithmetic-mean gain, Sharpe 0.85).
How far the testers would take the result
The testers limited the finding to this particular stochastic-crossover recipe looking poor to mediocre. They noted that no single test can prove an indicator useless in every form. They also warned against assuming the measure has value before the intended application is tested historically.
All readings on this track · 12 readings
- 1986Auditing stochastic crossovers with moving-average baselines
- 1994Evaluating system changes with chi-square, Sharpe, and leverage
- 1995Evaluating mechanical switch rules with a stop-loss order and Sharpe ratio
- 1995Intermediate-term allocation with drawdown filters
- 1996Evaluating a multi-market book without picking winners
- 1996Regime-aware allocation beyond a single equity trend
- 1997Evaluating managed futures as portfolio diversifiers
- 2008Audit an out-of-the-money covered-call overlay against a Sharpe control
- 2013Constructing the Sharpe ratio as return over variability
- 2014Expected value and bet size are separate controls
- 2015Constructing a Sharpe-style score from profit and loss variability
- 2019Continuous futures series and long-horizon allocation evaluation