2018issue C0926-27
Combining a weekly stochastic, a long moving average, and two-day resistance
The archive assigns a 70-day weekly stochastic the job of marking medium-term trend and pairs it with a daily stochastic to sort long versus short opportunities. Editorial reading treats that weekly print as a bias question, the 200-day simple moving average as a trend-state answer, and a two-day cup rim as a location test, so an oscillator extreme is discarded unless price has already left the prior session range.
- A 70-day weekly stochastic marks medium-term trend, and pairing it with a daily stochastic is the method given for sorting long versus short opportunities.
- The weekly and daily stochastic pair is required to be read with support and resistance and with moving averages, not as a standalone trigger.
- A cup breakout taken alone is treated as incomplete unless the cup forms above the prior day's high, so the same event also clears a two-day high.
- The intended trigger is a move through the cup rim after that rim has formed above the prior session high. Entries inside the prior day's high-low range are described as the least useful location.
How the pieces were assigned
The archive assigns a 70-day weekly stochastic the job of marking medium-term trend. Pairing that reading with a daily stochastic is the method given for sorting long versus short opportunities.
In an uptrend, a weekly oversold print is framed as a possible correction or reversal cue. In a downtrend, a weekly overbought print is framed the same way.
Editorial reading treats the weekly print as a bias question, the long moving average as a trend-state answer, and a two-day cup rim as a location test. On that reading, an oscillator extreme is discarded unless price has already left the prior session range.
Slow stochastic construction
The construction uses the slow stochastic with three-day smoothing so overbought and oversold prints are less jumpy. Lookback settings still depend on style and timeframe. The longer 70-day reading is assigned medium-term bias. The daily reading is assigned shorter-horizon timing.
Trend state on the long moving average
After a weekly stochastic returned to overbought, a bullish cross of a 200-day simple moving average and a later resistance break are listed as the confirmations that the medium-term trend had turned.
When the daily stochastic moved back to oversold, the same 200-day simple moving average is described as beginning to decline. The archive ties the oscillator and the average together as a joint state.
Location on a two-day high cup
A cup breakout taken alone is treated as incomplete. The added condition is that the cup forms above the prior day's high so the same event also clears a two-day high.
The intended trigger is a move through the cup rim after that rim has formed above the prior session high. Entries inside the prior day's high-low range are described as the least useful location.
Cup height is constrained to less than half of the prior day's range. Smaller cups are preferred. Rising volume on the right side of the cup is listed as extra confirmation.
Puxin ADR two-day cup breakout, 1-minute candles
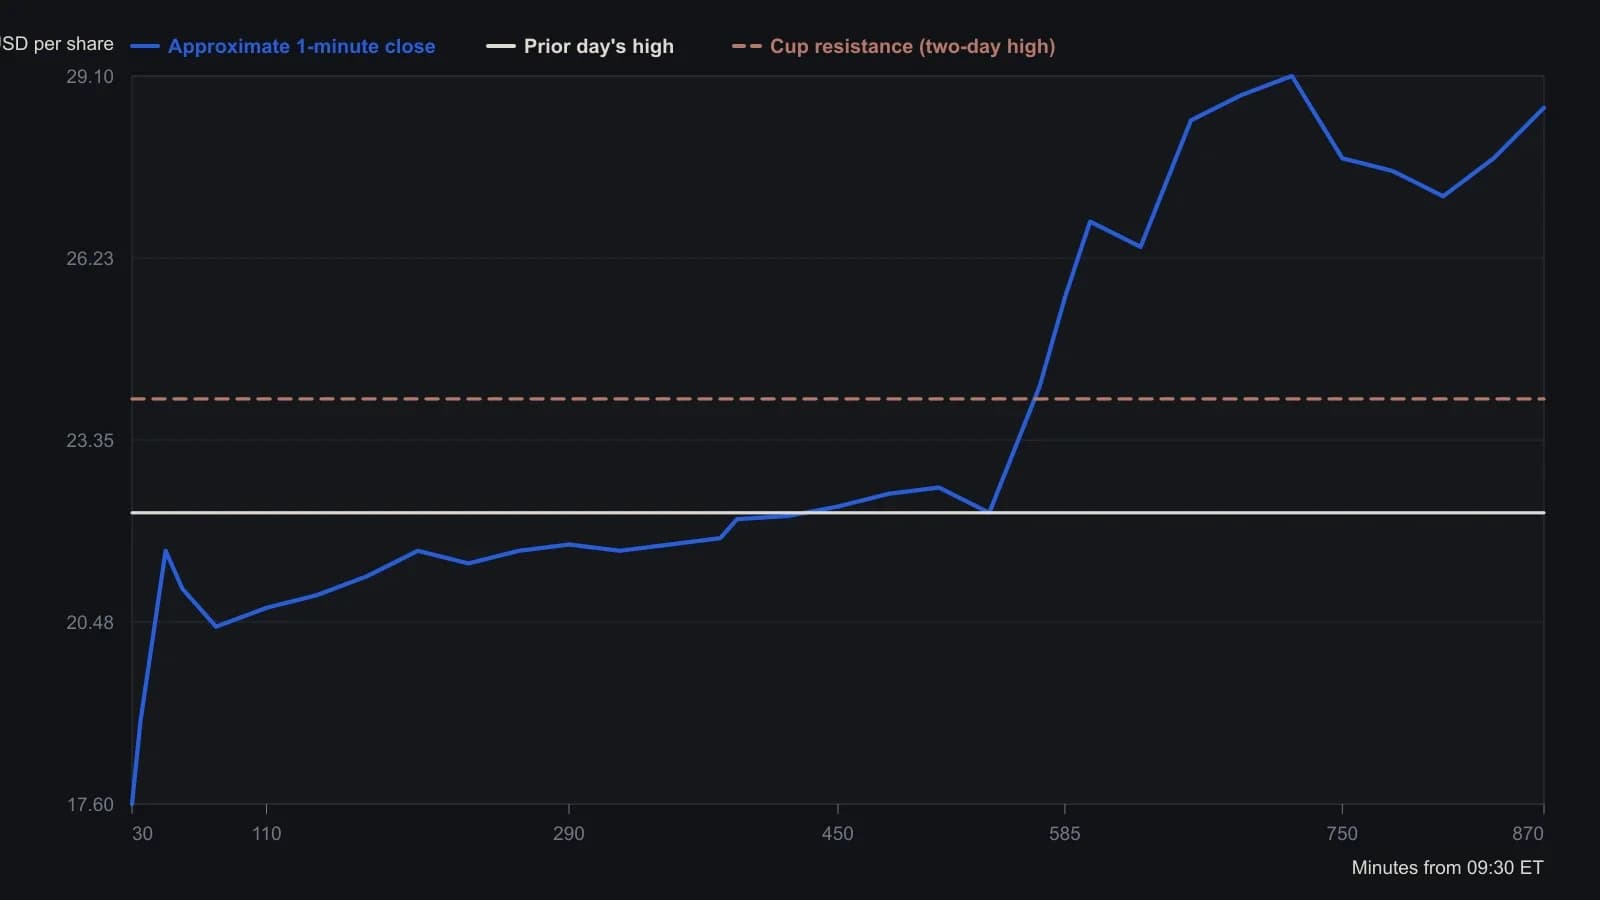
Digitized from the 1-minute candles on 15–18 June 2018. Intraday x-values are minutes from 09:30 ET; y-values are approximate closes in dollars per share, limited by raster resolution. The source also states cup resistance $24, entry $24.50, and a later high near $29.
Stated entry, invalidation, and trail
The stated entry is a 0.50 offset above the cup high. The stated invalidation is the cup low. The stated trailing exits are 0.50 for same-day holds and 2 for multi-day holds.
All readings on this track · 42 readings
- 1987Stochastic fast and slow construction as a rebuildable stack
- 1989Building the stochastic oscillator from close location
- 1990Monthly stochastics as a multi-year bond regime filter
- 1990Walk-forward screen for yen indicator rules
- 1990Slow stochastic construction for index pullback entries
- 1991Random Walk Index construction with an adaptive lookback
- 1991Building a two-stage stochastic oscillator from close location
- 1992Constructing fast and slow stochastic oscillator lines
- 1992Constructing nested stochastic lookbacks
- 1994Construct the four-state price-volume rank before filtering it
- 1996Crowded stochastics, false breakouts, and hidden stops
- 1997Fade and follow entries from stochastic extremes
- 1998Oversold confirmation as a staged rule-based-entry case
- 1999Constructing regular and slow stochastic oscillators
- 2001Construct a variable-interval simple moving average from stacked extremes
- 2001Threshold RSI and stochastic setups with next-bar stops
- 2001Two tests of a rate-adjusted earnings-yield gap
- 2002Constructing a two-line stochastic from a range-normalized close
- 2002Inspect mechanical stochastic daytrade rules on one bar
- 2003Constructing an adaptive stochastic RSI
- 2003Four parameters that construct a stochastic oscillator
- 2004Volume breakout as signal, pullback as entry
- 2004A first currency-market checklist with two averages and a slow stochastic
- 2005Shared-scale cycle indexes with companion oscillators
- 2005Current-bar versus prior-bar range construction for the stochastic oscillator
- 2005Two-session moving-average pullback short
- 2006Market condition as a permission layer for moving averages and oscillators
- 2008Lock the stop at support before sizing a stochastic entry
- 2010Construct a center-line volume oscillator and read it with a stochastic oscillator
- 2010Sharpened RSI turns with rainbow averages and a slow stochastic
- 2011Build a Spearman rank oscillator from ordered closes
- 2012Gold as a regime-dependent hedge in the euro-area crisis
- 2012Pairing moving averages with variable-length stochastics
- 2014Two-leg stochastic stress oscillator as a rebuild drill
- 2014Ingress dates as price bases for relative strength, stochastics, and moving averages
- 2017Constructing a dual EMA stochastic from range normalization
- 2018Constructing a two-stage stochastic RSI for comparable price-oscillator divergences
- 2018Combining a weekly stochastic, a long moving average, and two-day resistance
- 2018Weekly and daily stochastic readings with a long moving average and support
- 2018A confirming workflow for rotating from discretionary to staples
- 2019Stochastic scan thresholds, averages, and formula syntax
- 2020Constructing Slow %K as a two-stage helper