1996issue C091-10
Crowded stochastics, false breakouts, and hidden stops
Cheaper data and packaged mechanical systems are linked to more traders hitting the same stochastic-oscillator cross, range break, and stop-loss. Editorial reading: treat that overlap as one crowded-signal event, wait for the next bar, and park risk outside the cluster everyone else can see.
- Cheaper data, low-cost charting software, and packaged mechanical systems are linked to more traders acting on the same rules and to more frequent false signals, failed breakouts, and stop-running.
- A widely watched stochastic-oscillator drop below 30 is described as a rush of market buy orders, a brief lift, then a reversal once that demand is spent and the same traders cover.
- Illustrated Canadian-dollar and Deutschemark sessions show prices probing stop-loss clusters above recent highs and below recent lows, including a large upside gap that finished lower.
- Whipsaw control is framed as parking stops away from obvious highs and lows, reading a stochastic-oscillator push through 70 or 80 as trend persistence, and using a failure-reverse if the first two days of a breakout thrust fail.
Three triggers, one price
Cheaper data, low-cost charting software, and a surge of packaged mechanical systems are linked to more traders acting on the same rules. The same archive links that crowding to more frequent false signals, failed breakouts, and stop-running.
Editorial reading: a popular stochastic-oscillator cross, a textbook range break, and an obvious stop-loss are not three separate triggers. They can be one crowded-signal event at a shared price. The teaching sequence is to detect that price, wait for the next bar to confirm or fail, and park risk outside the cluster everyone else can see.
IMM Deutschemark 5×2 stochastic versus the 20 buy line
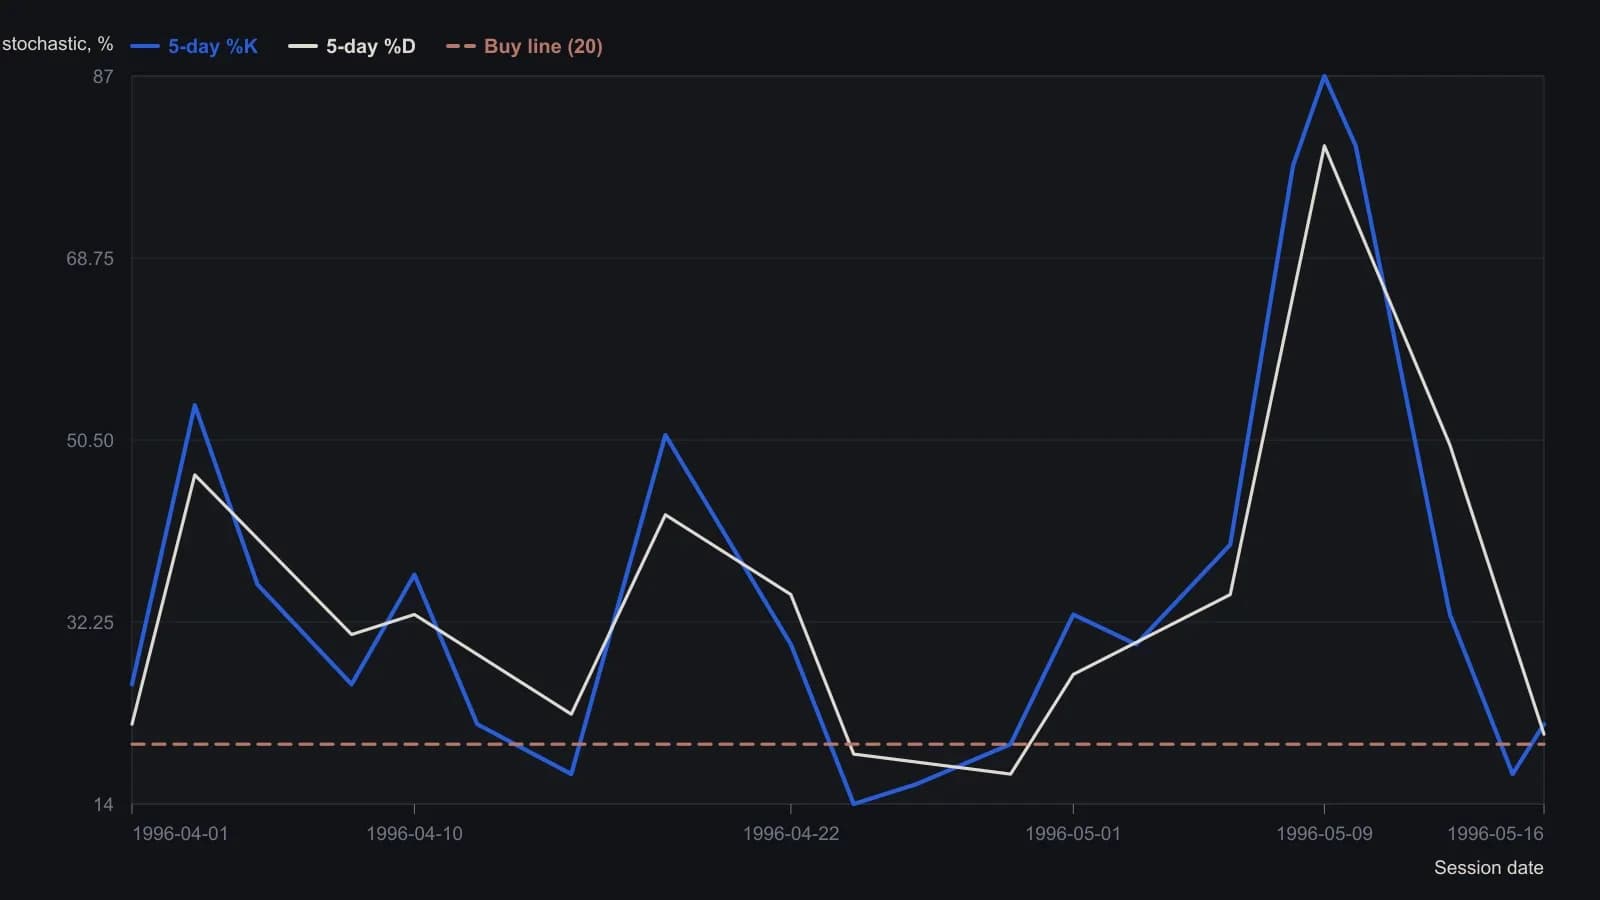
Source title is a 5×2 stochastic (five-day %K with two-day smoothing) on daily IMM Deutschemark. The pane marks 20 and 75; only the 20 buy line is carried, because that is the cross the text treats as the false-signal trigger. Dates between labeled ticks are placed by horizontal position on that raster.
When the oscillator fills, then empties
A widely watched stochastic-oscillator drop below 30 is described as launching a simultaneous rush of market buy orders, a brief lift, then a reversal once that demand is spent and the same traders cover.
On an illustrated Deutschemark contract, a five-day stochastic-oscillator crossing above 20 is treated as a buy. The next session erases nearly the entire advance as those buyers become sellers.
The same archive reads a stochastic-oscillator push through 70 or 80 as trend persistence rather than a fade. Editorial note: that reading treats the crowded-signal as already underway, not as a completed reversal cue.
Stop clusters above the high and below the low
Illustrated Canadian-dollar and Deutschemark sessions show prices probing stop-loss clusters above recent highs and below recent lows. One case is a large upside gap that finished lower. Another is a two-day 1.70 range that later traded back to the low side over the next seven sessions.
A January 25, 1996 Deutschemark session that opened above the prior high and closed below the prior low is labeled a very bearish one-day pattern. Seven sessions later the market closed higher after an intervening stop-running probe and pop.
Editorial reading: the first thrust through the obvious high or low can be stop-running rather than a completed false-breakout verdict. The next sessions still have to hold or fail.
Balance, coil, failed hold, and the large-range day
A session whose open and close print within two ticks is treated as open-close-balance, with a few ticks of slack for how exchanges report those prints. When that print sits near the high, the next one to two sessions are expected to choose a side.
Two consecutive lower highs and higher lows are described as uncommon on a third day. That two-day-coil lets stops accumulate beyond the compressed range. The next session often trends after those stops are taken, sometimes after a brief probe the other way.
A failed-hold-day sell is specified as an open near mid-range or lower with a close back through the open. The reverse geometry is used for a buy. Four coffee instances are shown, and the first is itself a false follow-through.
A large-range-day is sized so it occurs only a few times a month, about one to one-and-a-half points in currencies. The next session is framed as either slower continuation or a give-back. One illustrated case is a 1.80-point decline that retraced 50 percent the following day. Risk is then placed as a tight stop-loss beyond the close, or as a continuation stop beyond that day's extreme.
Park risk off the obvious edge
Whipsaw control is framed as parking stop-loss orders away from obvious highs and lows. It also includes the failure-reverse: flip side if a breakout thrust lasts only the first two days and then fails.
Editorial reading: the protective order is useful only when it sits outside the cluster a packaged system already shares. A stop-loss stacked on the same recent high or low can become the next target.
All readings on this track · 42 readings
- 1987Stochastic fast and slow construction as a rebuildable stack
- 1989Building the stochastic oscillator from close location
- 1990Monthly stochastics as a multi-year bond regime filter
- 1990Walk-forward screen for yen indicator rules
- 1990Slow stochastic construction for index pullback entries
- 1991Random Walk Index construction with an adaptive lookback
- 1991Building a two-stage stochastic oscillator from close location
- 1992Constructing fast and slow stochastic oscillator lines
- 1992Constructing nested stochastic lookbacks
- 1994Construct the four-state price-volume rank before filtering it
- 1996Crowded stochastics, false breakouts, and hidden stops
- 1997Fade and follow entries from stochastic extremes
- 1998Oversold confirmation as a staged rule-based-entry case
- 1999Constructing regular and slow stochastic oscillators
- 2001Construct a variable-interval simple moving average from stacked extremes
- 2001Threshold RSI and stochastic setups with next-bar stops
- 2001Two tests of a rate-adjusted earnings-yield gap
- 2002Constructing a two-line stochastic from a range-normalized close
- 2002Inspect mechanical stochastic daytrade rules on one bar
- 2003Constructing an adaptive stochastic RSI
- 2003Four parameters that construct a stochastic oscillator
- 2004Volume breakout as signal, pullback as entry
- 2004A first currency-market checklist with two averages and a slow stochastic
- 2005Shared-scale cycle indexes with companion oscillators
- 2005Current-bar versus prior-bar range construction for the stochastic oscillator
- 2005Two-session moving-average pullback short
- 2006Market condition as a permission layer for moving averages and oscillators
- 2008Lock the stop at support before sizing a stochastic entry
- 2010Construct a center-line volume oscillator and read it with a stochastic oscillator
- 2010Sharpened RSI turns with rainbow averages and a slow stochastic
- 2011Build a Spearman rank oscillator from ordered closes
- 2012Gold as a regime-dependent hedge in the euro-area crisis
- 2012Pairing moving averages with variable-length stochastics
- 2014Two-leg stochastic stress oscillator as a rebuild drill
- 2014Ingress dates as price bases for relative strength, stochastics, and moving averages
- 2017Constructing a dual EMA stochastic from range normalization
- 2018Constructing a two-stage stochastic RSI for comparable price-oscillator divergences
- 2018Combining a weekly stochastic, a long moving average, and two-day resistance
- 2018Weekly and daily stochastic readings with a long moving average and support
- 2018A confirming workflow for rotating from discretionary to staples
- 2019Stochastic scan thresholds, averages, and formula syntax
- 2020Constructing Slow %K as a two-stage helper