2004issue C121-2
A first currency-market checklist with two averages and a slow stochastic
This archive case records why one participant entered the currency market, which daily and short-horizon references were watched, and how a four-item lock had to be complete before any order. Editorial: the two-average overlay, the slow stochastic, and the lock are one abstention-capable procedure, not a pile of chart opinions.
- The participant named weekday-continuous sessions from Sunday evening through Friday evening and high margin leverage as the two reasons for entering the currency market.
- Intraday work used a multi-horizon-stack: a longer chart for trend alignment, an hourly or four-hour chart for setup, and a five-minute or one-minute chart for entry, after a five-minute default scan.
- Short-horizon overlays were a 10-period exponential moving average, a 40-period simple moving average, a slow stochastic at 14, 3, and 3, plus continued watch of the 100- and 200-period moving averages.
- The checklist-process fixed entry, exit, a favorable-side trailing stop, and an adverse hard stop before any order, under two standing rules: protect capital first, and execute only a planned trade.
What the case records
This archive article restates a historical currency-market workflow. Editorial: it is a first-currency-market case used to show how a two-average overlay, a slow stochastic, and a four-item pre-trade lock can operate as one procedure across daily, mid-horizon, and short sampling intervals.
Why the currency market
The participant named weekday-continuous sessions from Sunday evening through Friday evening and high margin leverage as the two reasons for entering the currency market.
The same account argued that gapless session-to-session pricing, very large daily turnover, and the two-currency structure of each pair make technical support and resistance more orderly than in many single-name equity markets.
Daily reference levels
Daily-horizon levels treated as relevant included Fibonacci retracements, 50-, 100-, and 200-day simple moving averages, trendlines, prior-session highs and lows, and double or triple tops and bottoms.
Those named references are the support-resistance-inventory of the case: Fibonacci retracements, selected moving averages, trendlines, prior-session extremes, and double or triple tops and bottoms, used to wait for opportunities.
How charts were stacked
Intraday scanning defaulted to five-minute charts. The operating sequence was then a multi-horizon-stack: a longer-horizon chart for trend alignment, an hourly or four-hour chart for setup, and a five-minute or one-minute chart for the entry point.
Short-horizon overlays
The short-horizon overlays specified were a 10-period exponential moving average, a 40-period simple moving average, a slow stochastic with parameters 14, 3, and 3, plus continued watch of the 100- and 200-period moving averages.
A moving-average in this case is a lookback average of ordered prices used as an explicit baseline on daily and intraday charts, including simple and exponential forms at named periods. The stochastic-oscillator is a bounded oscillator computed from recent highs, lows, and closes; the case specifies a slow setting of 14, 3, and 3.
A narrower personal subset
Early instruction covered moving averages, MACD, slow stochastics, Bollinger Bands, and the relative strength index before the trader narrowed the set to a personal subset.
The pre-trade lock
The operating checklist required deciding entry, exit, a trailing stop if price moved favorably, and a hard stop if price moved adversely before any action was taken. That four-item lock is the checklist-process: a pre-trade procedure that fixes entry, exit, a favorable-side trailing stop, and an adverse hard stop before any order is placed.
Two standing rules framed the process: protect capital first, and execute only a trade that had already been planned.
Euro futures daily closes against 50-, 100- and 200-day averages, January–October 2004
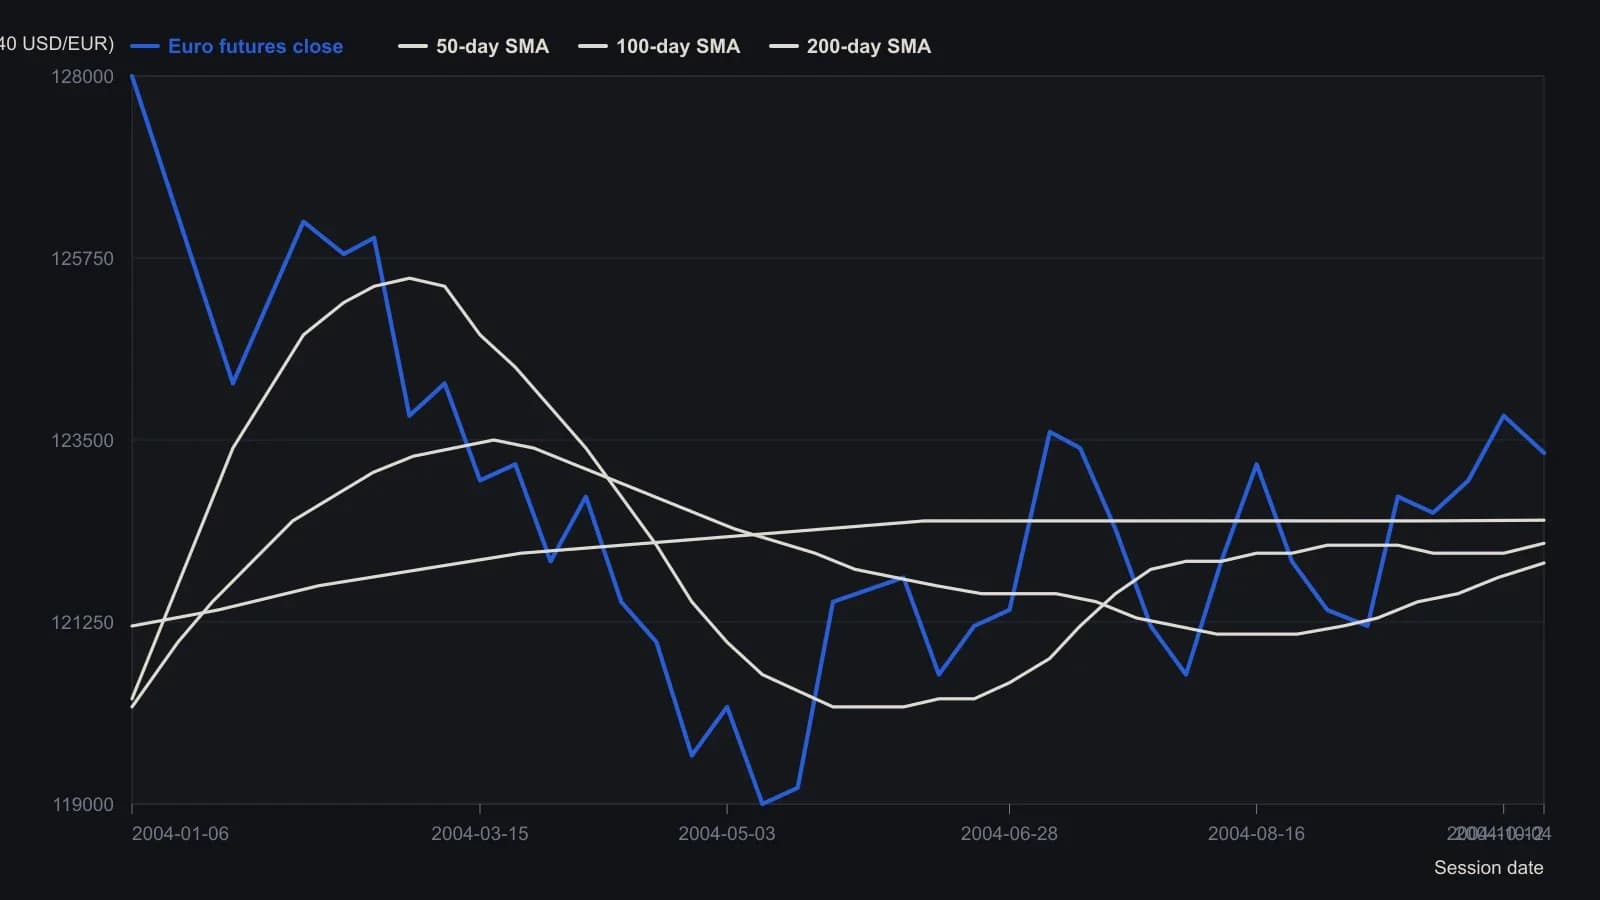
Average lengths follow the 50-, 100- and 200-day simple moving averages named in the interview and match the relative speed of the blue, red and green overlays. The 200-day series starts in July because that overlay is not drawn on the source chart before then. The rising May-low trendline visible on the figure is not plotted here.
All readings on this track · 42 readings
- 1987Stochastic fast and slow construction as a rebuildable stack
- 1989Building the stochastic oscillator from close location
- 1990Monthly stochastics as a multi-year bond regime filter
- 1990Walk-forward screen for yen indicator rules
- 1990Slow stochastic construction for index pullback entries
- 1991Random Walk Index construction with an adaptive lookback
- 1991Building a two-stage stochastic oscillator from close location
- 1992Constructing fast and slow stochastic oscillator lines
- 1992Constructing nested stochastic lookbacks
- 1994Construct the four-state price-volume rank before filtering it
- 1996Crowded stochastics, false breakouts, and hidden stops
- 1997Fade and follow entries from stochastic extremes
- 1998Oversold confirmation as a staged rule-based-entry case
- 1999Constructing regular and slow stochastic oscillators
- 2001Construct a variable-interval simple moving average from stacked extremes
- 2001Threshold RSI and stochastic setups with next-bar stops
- 2001Two tests of a rate-adjusted earnings-yield gap
- 2002Constructing a two-line stochastic from a range-normalized close
- 2002Inspect mechanical stochastic daytrade rules on one bar
- 2003Constructing an adaptive stochastic RSI
- 2003Four parameters that construct a stochastic oscillator
- 2004Volume breakout as signal, pullback as entry
- 2004A first currency-market checklist with two averages and a slow stochastic
- 2005Shared-scale cycle indexes with companion oscillators
- 2005Current-bar versus prior-bar range construction for the stochastic oscillator
- 2005Two-session moving-average pullback short
- 2006Market condition as a permission layer for moving averages and oscillators
- 2008Lock the stop at support before sizing a stochastic entry
- 2010Construct a center-line volume oscillator and read it with a stochastic oscillator
- 2010Sharpened RSI turns with rainbow averages and a slow stochastic
- 2011Build a Spearman rank oscillator from ordered closes
- 2012Gold as a regime-dependent hedge in the euro-area crisis
- 2012Pairing moving averages with variable-length stochastics
- 2014Two-leg stochastic stress oscillator as a rebuild drill
- 2014Ingress dates as price bases for relative strength, stochastics, and moving averages
- 2017Constructing a dual EMA stochastic from range normalization
- 2018Constructing a two-stage stochastic RSI for comparable price-oscillator divergences
- 2018Combining a weekly stochastic, a long moving average, and two-day resistance
- 2018Weekly and daily stochastic readings with a long moving average and support
- 2018A confirming workflow for rotating from discretionary to staples
- 2019Stochastic scan thresholds, averages, and formula syntax
- 2020Constructing Slow %K as a two-stage helper