2014issue C1342-48
Ingress dates as price bases for relative strength, stochastics, and moving averages
An ingress is a planet entering a new one of twelve equal sky regions. Those dates are read from an ephemeris and marked as candidate price bases, then compared with later price. Editorial view: the dated level is a scheduled reference, and the relative strength index, the stochastic oscillator, and a moving average still have to confirm whether price is holding, breaking, or stretching away from that base.
- An ingress is the moment a planet enters a new one of twelve equal sky regions, and those dated events are proposed as candidate price bases on a chart.
- Locate each ingress with an ephemeris first, then mark the print and compare it with later price, including later tests of the same support and resistance band.
- After a retest holds, observe the later move from that nearby reference and score it with the relative strength index, the stochastic oscillator, and a moving average over a defined lookback.
- The same dated-base construction applies to slower planets such as Uranus and to faster planets such as Mercury. Only the sampling interval of the event calendar changes.
What an ingress date marks
An ingress is defined as a planet entering a new one of twelve equal sky regions. Those dated events are proposed as candidate price bases on market charts.
A price base is a dated level near which an index or currency pair later advances, holds, or reverses after an ingress. The nearby price band around that print is support and resistance: later tests may hold, or the band may give way.
Find the date on the ephemeris first
Ingress dates are located with an ephemeris, a calendar of planetary positions, before they are compared with later price behavior. The calendar supplies the date. The chart supplies the later price reaction.
The same dated-base construction is applied to slower planets such as Uranus and to faster planets such as Mercury, changing only the sampling interval of the event calendar.
Historical price-base markings
On a Dow Jones Industrial Average chart, the Uranus ingress of Aries dated 2010-05-28 is presented as a later advance base.
On a Dow Jones Industrial Average chart, the Uranus ingress of Pisces dated 2003-03-11 is presented as a base for the 2003-07 advance and as later support at the same price area.
On a euro-US dollar chart, the Mercury ingress of Gemini dated 2013-05-15 is presented as a visible May 2013 low.
Moon ingresses are described as an intraday construction, with later price often remaining near the ingress print. Moves of more than about 25 pips are treated as a break of that nearby band.
DJIA daily with the May 2010 Uranus-Aries ingress as a price base
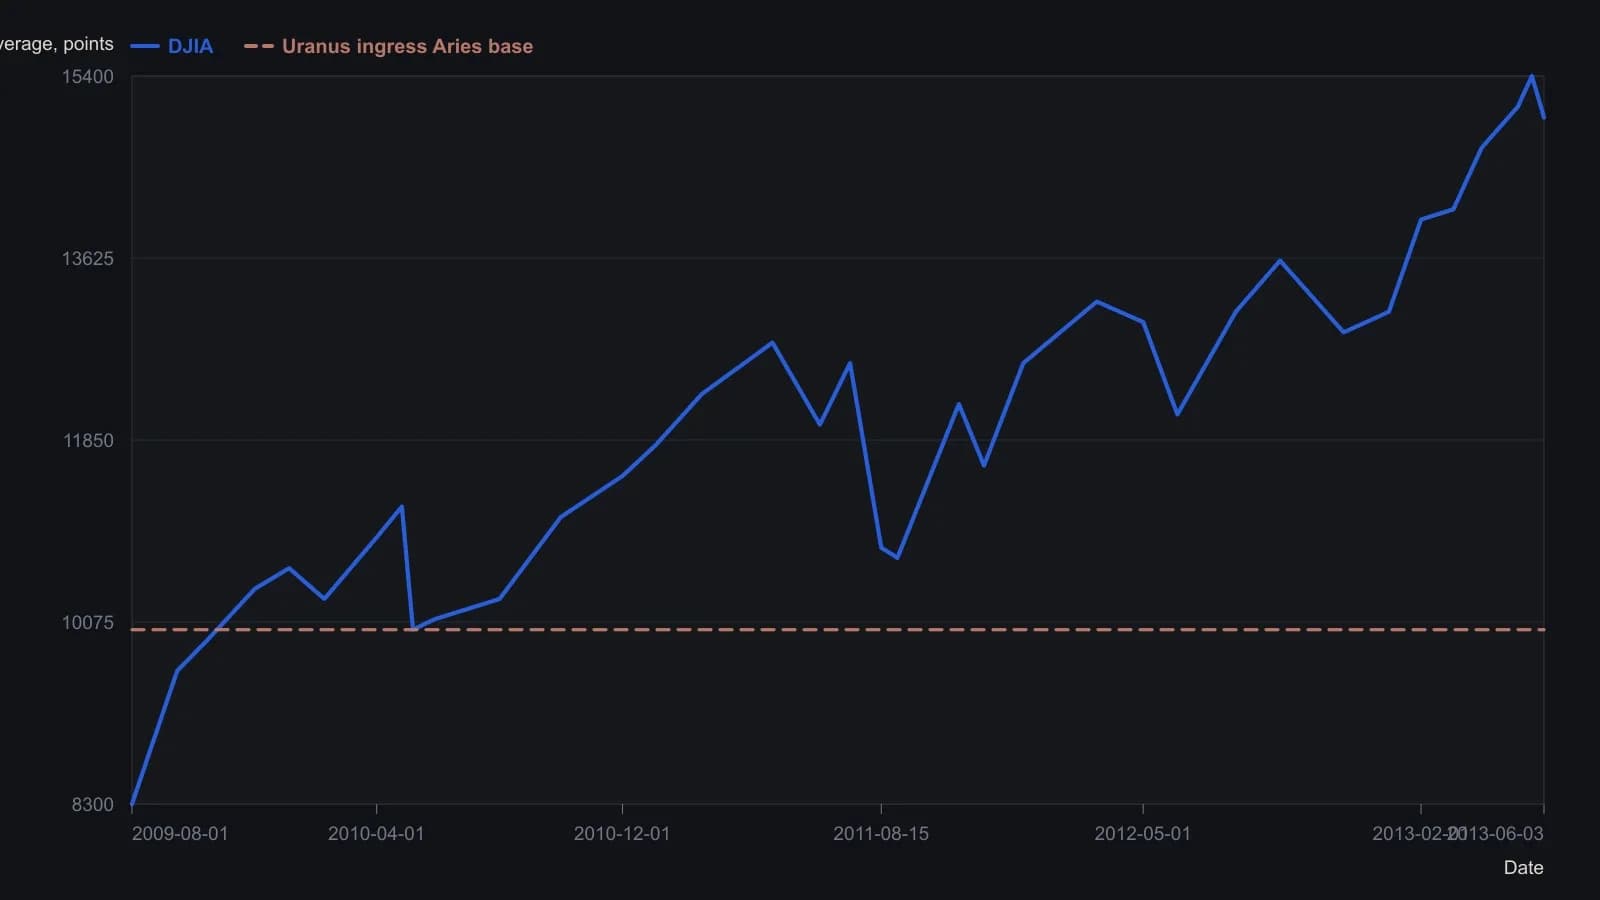
Y-values are approximate reads from the raster, rounded to 50 points, except the platform last print of 14,995.230. The author-drawn black bar is the May 28, 2010 ingress print, not a later calculated average.
When a retest holds
After an ingress level is retested and held, the construction is said to allow a larger subsequent move to be observed from a nearby reference rather than from an arbitrary entry. The dated print stays the reference. Later price is read against that band, not against an unrelated entry.
Confirm the move with the three filters
Editorial view: keep the ingress as a scheduled price-base event and ask the three quantitative filters whether the later move is still hugging the level, breaking it, or stretching away from it.
The relative strength index is an oscillator built from ordered price observations over a defined lookback. It scores whether a move away from an ingress base is stretched or still developing.
The stochastic oscillator is a range-position oscillator that compares the current close with a recent high-low window. It can confirm whether price is still hugging or breaking an ingress level.
A moving average is a smoothed price baseline over a stated sampling interval. It is used to judge whether an advance from an ingress date persists or fails.
Each filter is computed after the ingress date is marked. The lookback is the defined sampling window for that oscillator or average. The dated base stays the reference. The filters only score later ordered price observations.
All readings on this track · 42 readings
- 1987Stochastic fast and slow construction as a rebuildable stack
- 1989Building the stochastic oscillator from close location
- 1990Monthly stochastics as a multi-year bond regime filter
- 1990Walk-forward screen for yen indicator rules
- 1990Slow stochastic construction for index pullback entries
- 1991Random Walk Index construction with an adaptive lookback
- 1991Building a two-stage stochastic oscillator from close location
- 1992Constructing fast and slow stochastic oscillator lines
- 1992Constructing nested stochastic lookbacks
- 1994Construct the four-state price-volume rank before filtering it
- 1996Crowded stochastics, false breakouts, and hidden stops
- 1997Fade and follow entries from stochastic extremes
- 1998Oversold confirmation as a staged rule-based-entry case
- 1999Constructing regular and slow stochastic oscillators
- 2001Construct a variable-interval simple moving average from stacked extremes
- 2001Threshold RSI and stochastic setups with next-bar stops
- 2001Two tests of a rate-adjusted earnings-yield gap
- 2002Constructing a two-line stochastic from a range-normalized close
- 2002Inspect mechanical stochastic daytrade rules on one bar
- 2003Constructing an adaptive stochastic RSI
- 2003Four parameters that construct a stochastic oscillator
- 2004Volume breakout as signal, pullback as entry
- 2004A first currency-market checklist with two averages and a slow stochastic
- 2005Shared-scale cycle indexes with companion oscillators
- 2005Current-bar versus prior-bar range construction for the stochastic oscillator
- 2005Two-session moving-average pullback short
- 2006Market condition as a permission layer for moving averages and oscillators
- 2008Lock the stop at support before sizing a stochastic entry
- 2010Construct a center-line volume oscillator and read it with a stochastic oscillator
- 2010Sharpened RSI turns with rainbow averages and a slow stochastic
- 2011Build a Spearman rank oscillator from ordered closes
- 2012Gold as a regime-dependent hedge in the euro-area crisis
- 2012Pairing moving averages with variable-length stochastics
- 2014Two-leg stochastic stress oscillator as a rebuild drill
- 2014Ingress dates as price bases for relative strength, stochastics, and moving averages
- 2017Constructing a dual EMA stochastic from range normalization
- 2018Constructing a two-stage stochastic RSI for comparable price-oscillator divergences
- 2018Combining a weekly stochastic, a long moving average, and two-day resistance
- 2018Weekly and daily stochastic readings with a long moving average and support
- 2018A confirming workflow for rotating from discretionary to staples
- 2019Stochastic scan thresholds, averages, and formula syntax
- 2020Constructing Slow %K as a two-stage helper