1998issue C101-4
Oversold confirmation as a staged rule-based-entry case
A daily oversold relative-strength-index and stochastic-oscillator screen was only the first filter in a staged rule-based-entry sequence. The procedure withheld the buy until weekly oscillators confirmed and a daily close reclaimed the required average, then later exited when a new high failed to extend.
- The daily oversold oscillator screen was only a candidate filter. Weekly relative-strength-index and stochastic-oscillator confirmation could still withhold the buy.
- Multiple-time-frame-confirmation used daily data to screen, a higher-timeframe chart to confirm trend, and a 60-minute chart only to time the fill.
- When the 50-day average was below the 200-day average, price still had to stand at least above the 50-day average. When the 50-day average was above the 200-day average, price had to stand at least above the 200-day average.
- A dip back under the 50-day average did not cancel the long. Close-based-invalidation sat just below the 52-week low, and a failed-extension-exit followed a new high that failed for three sessions.
The daily screen only created a candidate
The daily rule-based-entry screen required a 3-period relative-strength-index to cross above a 14-period relative-strength-index and a 14-period stochastic-oscillator %K and %D crossover with both values below 25.
Editorial: rule-based-entry here means a predefined procedure that converts oscillator, trend, and location tests into enter, exit, or abstain actions. The daily crossover is a watchlist event, not a fill.
Price still had to reclaim an average
When the 50-day average was below the 200-day average, the buy screen still required price at least above the 50-day average.
When the 50-day average was above the 200-day average, price had to stand at least above the 200-day average.
Baldor Electric daily close versus 50-day and 200-day averages
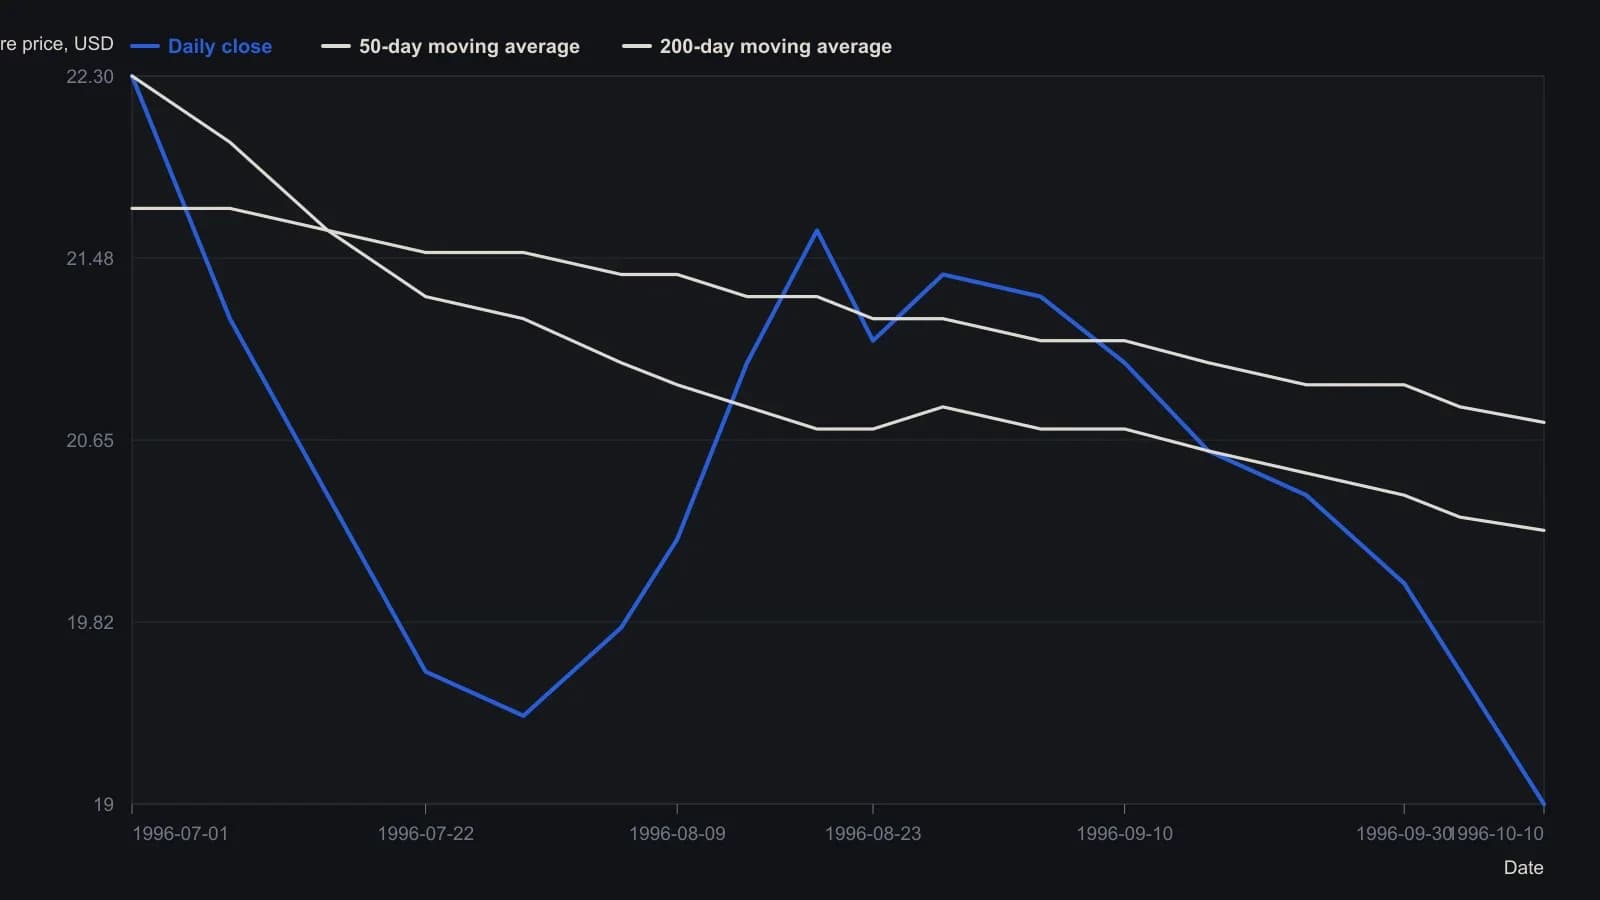
Earlier closes and both average traces are read from the raster to about a tenth of a dollar. The 10 October close ($19.00) and the two moving-average prints (20.240 and 20.726) are the TradeStation header values.
Screen, confirm, then time
Candidate selection used daily data, trend confirmation used a higher-timeframe chart, and entry timing used a 60-minute chart.
Editorial: that split is multiple-time-frame-confirmation. A lower timeframe screens, a higher timeframe confirms trend, and an intraday chart is used only to time the fill.
Weekly oscillators could still withhold the buy
After the daily oscillator screen triggered, weekly relative-strength-index and stochastic-oscillator readings were still treated as an unfinished downtrend, so the procedure withheld a buy.
Weekly relative-strength-index and stochastic-oscillator bullish crossovers were treated as the required trend-change confirmation.
Editorial: those weekly tests are the higher-timeframe trend confirmation in this case.
The 60-minute chart timed the fill
The entry was taken from the 60-minute chart only after a daily close stood above the 50-day average and the weekly oscillators were in a bullish mode.
A dip did not cancel the position
A later dip back under the 50-day average did not cancel the position. A close-based stop was set just below the 52-week low after the original checklist was rechecked.
Editorial: that stop is close-based-invalidation. It triggers on a closing print beyond a preselected level rather than on an intraday spike.
When a new high failed to extend
Exit watch began when price was above both the 50-day and 200-day averages while the stochastic-oscillator was overbought, the 3-period relative-strength-index was above 90, and MACD was declining toward zero.
The designated exit arrived after price printed a new high and then failed to penetrate that high for three consecutive sessions.
Editorial: that close is a failed-extension-exit, leaving a long after price prints a new high and then cannot push through that high for a stated number of sessions.
All readings on this track · 42 readings
- 1987Stochastic fast and slow construction as a rebuildable stack
- 1989Building the stochastic oscillator from close location
- 1990Monthly stochastics as a multi-year bond regime filter
- 1990Walk-forward screen for yen indicator rules
- 1990Slow stochastic construction for index pullback entries
- 1991Random Walk Index construction with an adaptive lookback
- 1991Building a two-stage stochastic oscillator from close location
- 1992Constructing fast and slow stochastic oscillator lines
- 1992Constructing nested stochastic lookbacks
- 1994Construct the four-state price-volume rank before filtering it
- 1996Crowded stochastics, false breakouts, and hidden stops
- 1997Fade and follow entries from stochastic extremes
- 1998Oversold confirmation as a staged rule-based-entry case
- 1999Constructing regular and slow stochastic oscillators
- 2001Construct a variable-interval simple moving average from stacked extremes
- 2001Threshold RSI and stochastic setups with next-bar stops
- 2001Two tests of a rate-adjusted earnings-yield gap
- 2002Constructing a two-line stochastic from a range-normalized close
- 2002Inspect mechanical stochastic daytrade rules on one bar
- 2003Constructing an adaptive stochastic RSI
- 2003Four parameters that construct a stochastic oscillator
- 2004Volume breakout as signal, pullback as entry
- 2004A first currency-market checklist with two averages and a slow stochastic
- 2005Shared-scale cycle indexes with companion oscillators
- 2005Current-bar versus prior-bar range construction for the stochastic oscillator
- 2005Two-session moving-average pullback short
- 2006Market condition as a permission layer for moving averages and oscillators
- 2008Lock the stop at support before sizing a stochastic entry
- 2010Construct a center-line volume oscillator and read it with a stochastic oscillator
- 2010Sharpened RSI turns with rainbow averages and a slow stochastic
- 2011Build a Spearman rank oscillator from ordered closes
- 2012Gold as a regime-dependent hedge in the euro-area crisis
- 2012Pairing moving averages with variable-length stochastics
- 2014Two-leg stochastic stress oscillator as a rebuild drill
- 2014Ingress dates as price bases for relative strength, stochastics, and moving averages
- 2017Constructing a dual EMA stochastic from range normalization
- 2018Constructing a two-stage stochastic RSI for comparable price-oscillator divergences
- 2018Combining a weekly stochastic, a long moving average, and two-day resistance
- 2018Weekly and daily stochastic readings with a long moving average and support
- 2018A confirming workflow for rotating from discretionary to staples
- 2019Stochastic scan thresholds, averages, and formula syntax
- 2020Constructing Slow %K as a two-stage helper