2001issue C071-5
Construct a variable-interval simple moving average from stacked extremes
This article shows how a simple moving-average lookback is set in proportion to a composite extreme score and a short-and-long length pair. The pair is treated as usable only when it stays in place across historical windows.
- The variable-interval construction interpolates a simple moving-average lookback between the short and long members of a length pair, using the long length at a composite extreme-score high and the short length at a score low.
- The composite extreme score sums, across lookbacks 2 through 35, each of the latest 250 price differences ranked from 0 to 1 inside that lookback's min-max range, because a single-horizon relative-strength-index or stochastic-oscillator reading can sit at an extreme while a neighboring horizon does not.
- The daily lookback is the short length plus the pair span times the composite score's 0-to-1 position in its own range, rounded to an integer, so a 10-and-40 pair at mid-range yields 25.
- Length pairs are chosen by exhaustive historical comparison and kept only when they change slowly across windows. The plotted average is then marked up or down from the prior bar as the directional reading.
What the construction sets
The variable-interval construction sets a simple moving-average lookback in proportion to a composite extreme score. It uses the long member of a length pair at the score high and the short member at the score low.
Here a moving average is a simple average of ordered prices whose integer lookback is interpolated each bar between a short bound and a long bound instead of being held fixed. A length pair is that short lookback and long lookback. The pair is chosen by comparing many pairs on recent history.
Why the score stacks many horizons
A relative-strength-index is a single-horizon overbought/oversold oscillator that scores up versus down closes over one fixed lookback. A stochastic-oscillator is a single-horizon overbought/oversold oscillator that places the close inside one fixed high-low window. Both are used here as the baseline families a stacked-interval score is built to replace.
A single-horizon relative-strength-index or stochastic-oscillator reading can sit at an extreme while a neighboring horizon does not. That is why the construction sums many intervals rather than relying on one.
How the composite extreme score is built
For each lookback from 2 through 35, each of the latest 250 price differences is mapped to a 0-to-1 position in that lookback's min-max range. Those positions are summed across lookbacks to form the composite extreme score.
Interpolate a length from the pair
The daily lookback is the short length plus the pair span times the composite score's 0-to-1 position in its own range, rounded to an integer. A 10-and-40 pair at mid-range therefore yields 25.
VIMA oscillator from stacked 2-, 3- and 4-day extremes
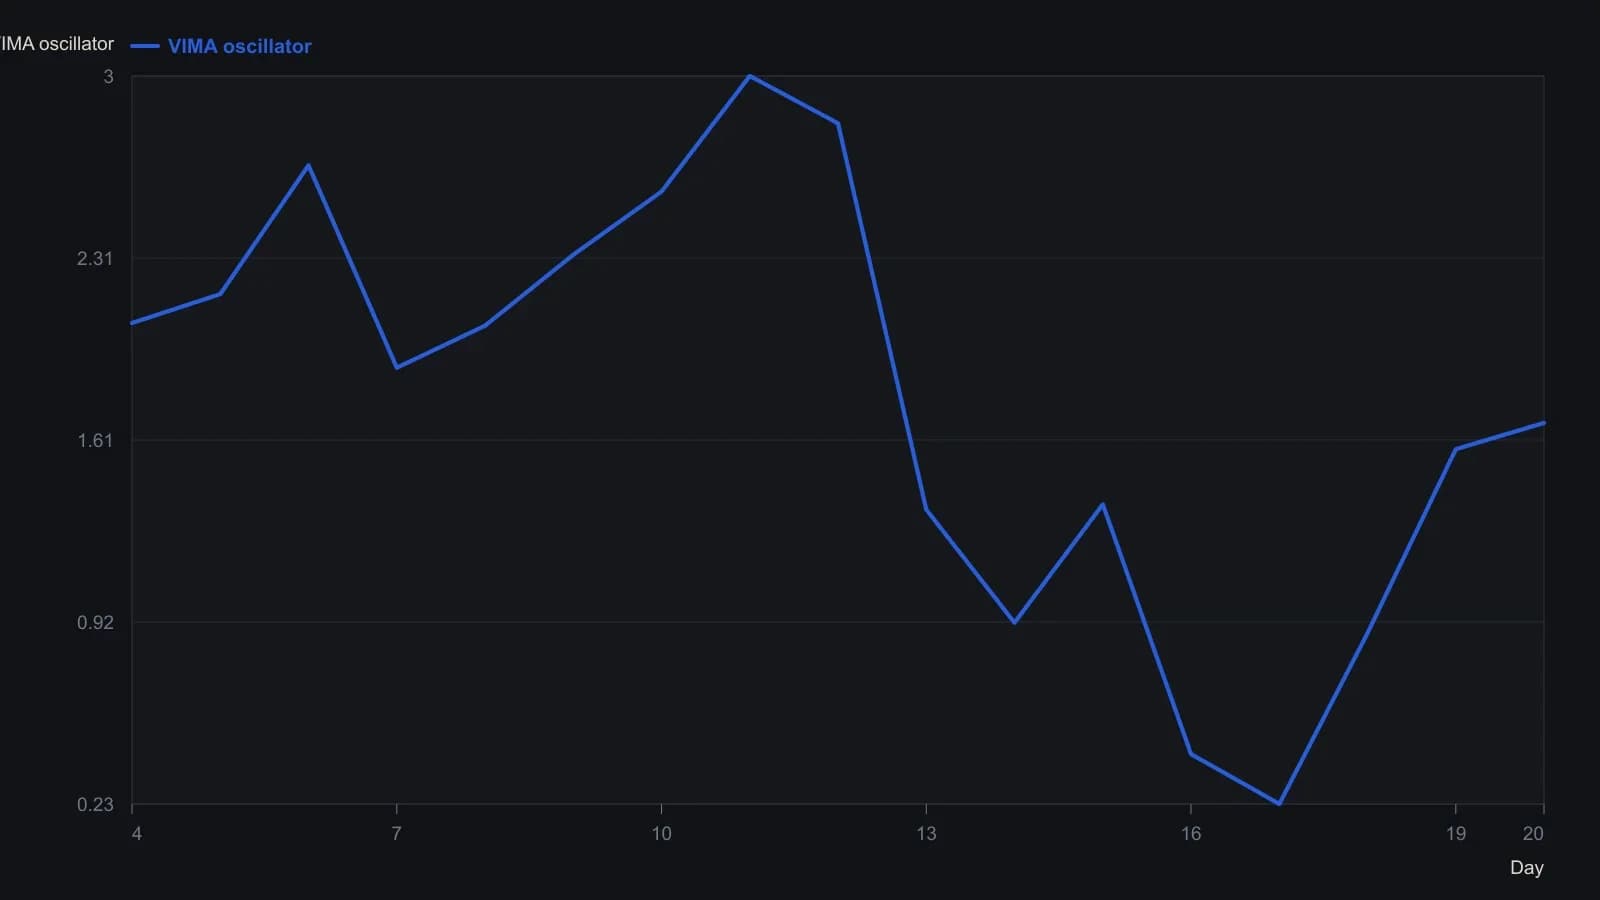
The published worksheet stacks only intervals 2, 3 and 4 over 20 closes so the arithmetic stays readable. The live VIMA oscillator repeats the same min–max normalization for every interval from 2 through 35 across the latest 250 datapoints.
Read the pair map
On the pair map the diagonal marks equal lengths. Pairs below the diagonal shorten the average as the composite score rises and lengthen it as the score falls. Pairs above the diagonal reverse that mapping.
Keep a pair only when it stays put
Length pairs are chosen by exhaustive historical comparison. The construction is treated as usable only when the preferred pair changes slowly across windows rather than jumping. Pair-stability is that construction gate: a historically preferred length pair must stay in roughly the same place across successive windows before the variable average is treated as usable.
Three 250-session windows on a major equity index, with endpoints 50 sessions apart, selected the same length pair and showed similar pair-map geography. The method reads that pattern as slow pair drift.
Mark the average up or down
The plotted variable average is marked up when its value exceeds the prior bar and marked down when it is below the prior bar. That one-bar sign is the construction's directional reading.
All readings on this track · 42 readings
- 1987Stochastic fast and slow construction as a rebuildable stack
- 1989Building the stochastic oscillator from close location
- 1990Monthly stochastics as a multi-year bond regime filter
- 1990Walk-forward screen for yen indicator rules
- 1990Slow stochastic construction for index pullback entries
- 1991Random Walk Index construction with an adaptive lookback
- 1991Building a two-stage stochastic oscillator from close location
- 1992Constructing fast and slow stochastic oscillator lines
- 1992Constructing nested stochastic lookbacks
- 1994Construct the four-state price-volume rank before filtering it
- 1996Crowded stochastics, false breakouts, and hidden stops
- 1997Fade and follow entries from stochastic extremes
- 1998Oversold confirmation as a staged rule-based-entry case
- 1999Constructing regular and slow stochastic oscillators
- 2001Construct a variable-interval simple moving average from stacked extremes
- 2001Threshold RSI and stochastic setups with next-bar stops
- 2001Two tests of a rate-adjusted earnings-yield gap
- 2002Constructing a two-line stochastic from a range-normalized close
- 2002Inspect mechanical stochastic daytrade rules on one bar
- 2003Constructing an adaptive stochastic RSI
- 2003Four parameters that construct a stochastic oscillator
- 2004Volume breakout as signal, pullback as entry
- 2004A first currency-market checklist with two averages and a slow stochastic
- 2005Shared-scale cycle indexes with companion oscillators
- 2005Current-bar versus prior-bar range construction for the stochastic oscillator
- 2005Two-session moving-average pullback short
- 2006Market condition as a permission layer for moving averages and oscillators
- 2008Lock the stop at support before sizing a stochastic entry
- 2010Construct a center-line volume oscillator and read it with a stochastic oscillator
- 2010Sharpened RSI turns with rainbow averages and a slow stochastic
- 2011Build a Spearman rank oscillator from ordered closes
- 2012Gold as a regime-dependent hedge in the euro-area crisis
- 2012Pairing moving averages with variable-length stochastics
- 2014Two-leg stochastic stress oscillator as a rebuild drill
- 2014Ingress dates as price bases for relative strength, stochastics, and moving averages
- 2017Constructing a dual EMA stochastic from range normalization
- 2018Constructing a two-stage stochastic RSI for comparable price-oscillator divergences
- 2018Combining a weekly stochastic, a long moving average, and two-day resistance
- 2018Weekly and daily stochastic readings with a long moving average and support
- 2018A confirming workflow for rotating from discretionary to staples
- 2019Stochastic scan thresholds, averages, and formula syntax
- 2020Constructing Slow %K as a two-stage helper