2018issue C1140-43
A confirming workflow for rotating from discretionary to staples
After the advance from the March 9, 2009 low was widely described as the longest bull market on record, the archive compared liquid discretionary and staples vehicles and marked a June 7, 2018 XLP entry only when the XLY-to-XLP relative-strength line, the Stochastic oscillator, and the Relative Strength Index all printed negative crossovers.
- Consumer discretionary names such as retailers, hotels, apparel, restaurants, leisure, durables, autos, and media were presented as expansion-sensitive, while staples such as food, beverages, household products, drugs, and tobacco were presented as contraction-resilient, without a one-to-one correlation.
- Among six discretionary ETFs compared, XLY led on assets, volume, and listing depth, while FDIS and VCR were the next most liquid, lower-cost vehicles. XLP, FSTA, and VDC were identified as the most suitable staples ETFs on the same comparison.
- A June 7, 2018 XLP entry was marked when the XLY-to-XLP relative-strength line, the Stochastic oscillator, and the Relative Strength Index all printed negative crossovers. From that date through August 20, 2018, XLP advanced 10.37% while XLY advanced 3.57% and the S&P 500 advanced 3.13%.
- The source treated MACD, the Relative Strength Index, the Stochastic oscillator, and a 50-day Moving average as a confirming exit toolkit if expected discretionary outperformance in bull markets failed to persist.
A long bull market framed the need for an exit plan
By August 22, 2018 the advance from the March 9, 2009 low was widely described as the longest bull market on record, which framed the need for an exit plan before a later contraction.
Two sleeves, not a one-to-one match
Consumer discretionary names such as retailers, hotels, apparel, restaurants, leisure, durables, autos, and media were presented as expansion-sensitive, while staples such as food, beverages, household products, drugs, and tobacco were presented as contraction-resilient, without a one-to-one correlation.
Choose the liquid discretionary vehicle first
Among six discretionary ETFs compared, XLY led on assets under management at $14 billion, average daily volume of about 5.5 million shares, inception dating to December 16, 1998, a 0.01% average bid-ask ratio, and a 14.3% three-year annualized return, while also being the only name with both options and futures listed.
FDIS and VCR were the next most liquid, lower-cost discretionary vehicles, with expense ratios of 0.08% and 0.10%, daily volume near 128,000 and 89,000 shares, three-year annualized returns near 13%, and XTF ratings of 9.4 and 9.2.
The staples shortlist followed the same liquidity screen
XLP, FSTA, and VDC were identified as the most suitable staples ETFs on the same comparison, combining the highest XTF ratings, the largest assets and volume, yields of 2.53% or more, and the lowest expense ratios, with all three posting positive net asset flows over one- and three-year windows.
Wait for the line and the oscillators to agree
A June 7, 2018 XLP entry was marked when the XLY-to-XLP relative-strength line, the Stochastic oscillator, and the Relative Strength Index all printed negative crossovers, showing discretionary weakening versus staples.
From June 7, 2018 through August 20, 2018, XLP advanced 10.37% while XLY advanced 3.57% and the S&P 500 advanced 3.13%, illustrating a short defensive window after those confirming crossovers.
A confirming toolkit if discretionary leadership failed
The source treated MACD, the Relative Strength Index, the Stochastic oscillator, and a 50-day Moving average as a confirming exit toolkit if the expected discretionary outperformance in bull markets failed to persist.
A later classification change reset the discretionary sleeve
A September 28, 2018 GICS reclassification removed the Telecommunications Services sector, created Communications Services as XLC, and moved 18 names out of XLY, including 16 media holdings that represented 25.79% of that portfolio, while leaving Amazon's 23% weight in place.
XLY-to-XLP relative strength around the June 2018 staples entry
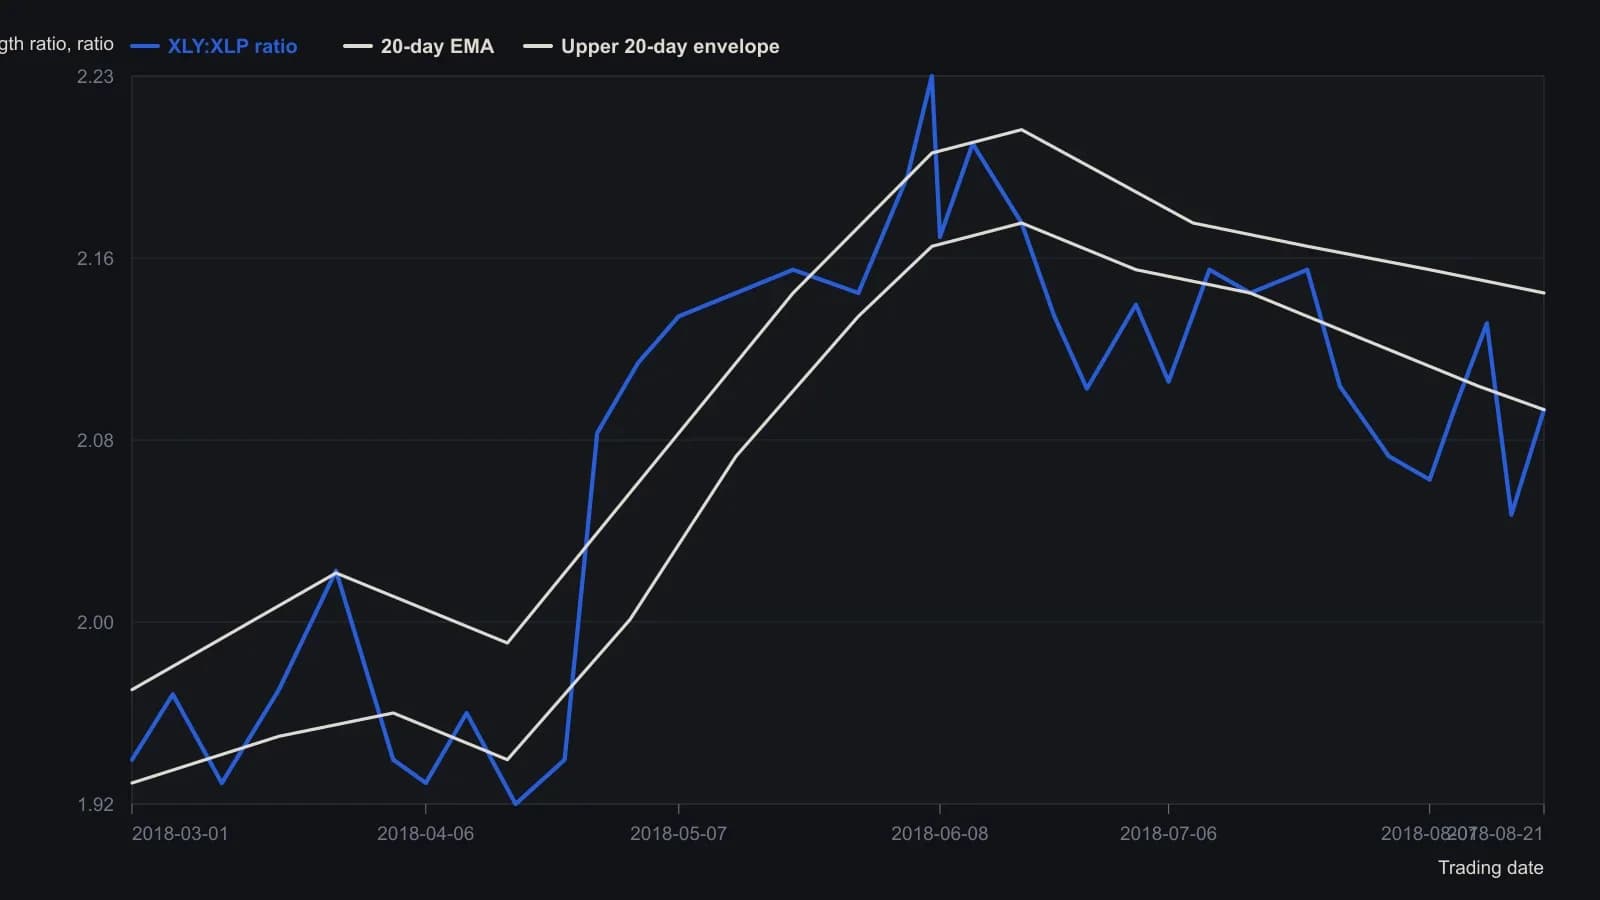
Printed tags such as 2.233, 2.021 and 1.921 are exact reads from the plot. Unmarked vertices are visual estimates to two decimals. The green study is the labelled 20-day EMA with a 2.5-width envelope. Oscillator panes were left off because they use a 0–100 scale.
All readings on this track · 42 readings
- 1987Stochastic fast and slow construction as a rebuildable stack
- 1989Building the stochastic oscillator from close location
- 1990Monthly stochastics as a multi-year bond regime filter
- 1990Walk-forward screen for yen indicator rules
- 1990Slow stochastic construction for index pullback entries
- 1991Random Walk Index construction with an adaptive lookback
- 1991Building a two-stage stochastic oscillator from close location
- 1992Constructing fast and slow stochastic oscillator lines
- 1992Constructing nested stochastic lookbacks
- 1994Construct the four-state price-volume rank before filtering it
- 1996Crowded stochastics, false breakouts, and hidden stops
- 1997Fade and follow entries from stochastic extremes
- 1998Oversold confirmation as a staged rule-based-entry case
- 1999Constructing regular and slow stochastic oscillators
- 2001Construct a variable-interval simple moving average from stacked extremes
- 2001Threshold RSI and stochastic setups with next-bar stops
- 2001Two tests of a rate-adjusted earnings-yield gap
- 2002Constructing a two-line stochastic from a range-normalized close
- 2002Inspect mechanical stochastic daytrade rules on one bar
- 2003Constructing an adaptive stochastic RSI
- 2003Four parameters that construct a stochastic oscillator
- 2004Volume breakout as signal, pullback as entry
- 2004A first currency-market checklist with two averages and a slow stochastic
- 2005Shared-scale cycle indexes with companion oscillators
- 2005Current-bar versus prior-bar range construction for the stochastic oscillator
- 2005Two-session moving-average pullback short
- 2006Market condition as a permission layer for moving averages and oscillators
- 2008Lock the stop at support before sizing a stochastic entry
- 2010Construct a center-line volume oscillator and read it with a stochastic oscillator
- 2010Sharpened RSI turns with rainbow averages and a slow stochastic
- 2011Build a Spearman rank oscillator from ordered closes
- 2012Gold as a regime-dependent hedge in the euro-area crisis
- 2012Pairing moving averages with variable-length stochastics
- 2014Two-leg stochastic stress oscillator as a rebuild drill
- 2014Ingress dates as price bases for relative strength, stochastics, and moving averages
- 2017Constructing a dual EMA stochastic from range normalization
- 2018Constructing a two-stage stochastic RSI for comparable price-oscillator divergences
- 2018Combining a weekly stochastic, a long moving average, and two-day resistance
- 2018Weekly and daily stochastic readings with a long moving average and support
- 2018A confirming workflow for rotating from discretionary to staples
- 2019Stochastic scan thresholds, averages, and formula syntax
- 2020Constructing Slow %K as a two-stage helper