1989issue C101-3
Evaluating venue volume as a speculation-breadth signal
Secondary-listed and over-the-counter volume can be treated as a speculation-proxy because those names are typically smaller and more volatile than primary-exchange listings. The evaluation habit is to convert that activity into a deviation from an exponential average, then ask whether a late-year seasonal lift can produce the same spike a trader might read as a regime warning.
- Secondary-listed volume can be treated as a market-breadth speculation signal because those names are typically smaller in capitalization and more volatile than primary-exchange listings.
- Over-the-counter volume is proposed as an even more sensitive speculation-proxy because typical names there are more volatile still.
- A fixed-percentage exponential average turns raw venue volume into a multi-year deviation so changing listed share counts do not dominate the reading.
- A recurring late-year rise, often finishing in a last-week spike, can lift a speculation-breadth series independently of a new market regime.
A habit for evaluating speculation breadth
Editorial framing: start with a hypothesis, not a verdict. Secondary-venue volume is a claim about risk-seeking participation. The job of evaluation is to see whether that claim still holds after listing growth and the calendar have been given a chance to explain the same move.
The archive uses venue-level volume as market-breadth on the premise that smaller and more volatile listings attract fast-turn demand more than primary-exchange names.
Why smaller venues are the speculation-proxy
Secondary-listed volume can be treated as a market-breadth speculation signal because those names are typically smaller in capitalization and more volatile than primary-exchange listings.
Over-the-counter volume is proposed as an even more sensitive speculation-proxy than secondary-listed volume because typical over-the-counter names are more volatile still.
The archive also records primary-exchange volume beside the two smaller venues, so the speculation-proxy is compared with the main listing tape rather than read in isolation.
Why the series is a deviation, not a raw total
As listed share counts change, a raw volume total can rise without any change in speculative intensity. The archive therefore expresses volume as a deviation from a fixed-percentage exponential average over a multi-year window.
Exponential-smoothing here is that fixed-percentage average. It turns raw venue volume into a multi-year deviation so changing listed share counts do not dominate the reading. Editorial point: that baseline is what keeps listing growth from masquerading as heat.
When a year-end lift can mimic a warning
Once the series is detrended, the archive shows a recurring year-end seasonal lift in the speculation reading, often culminating in an upward spike in the final week.
Seasonality-analysis here is inspection of that recurring late-year rise. Editorial reading: the same spike a trader might treat as a regime warning can appear from the calendar overlay alone.
OTC volume deviation from a 3.77% exponential average, 1984–1989
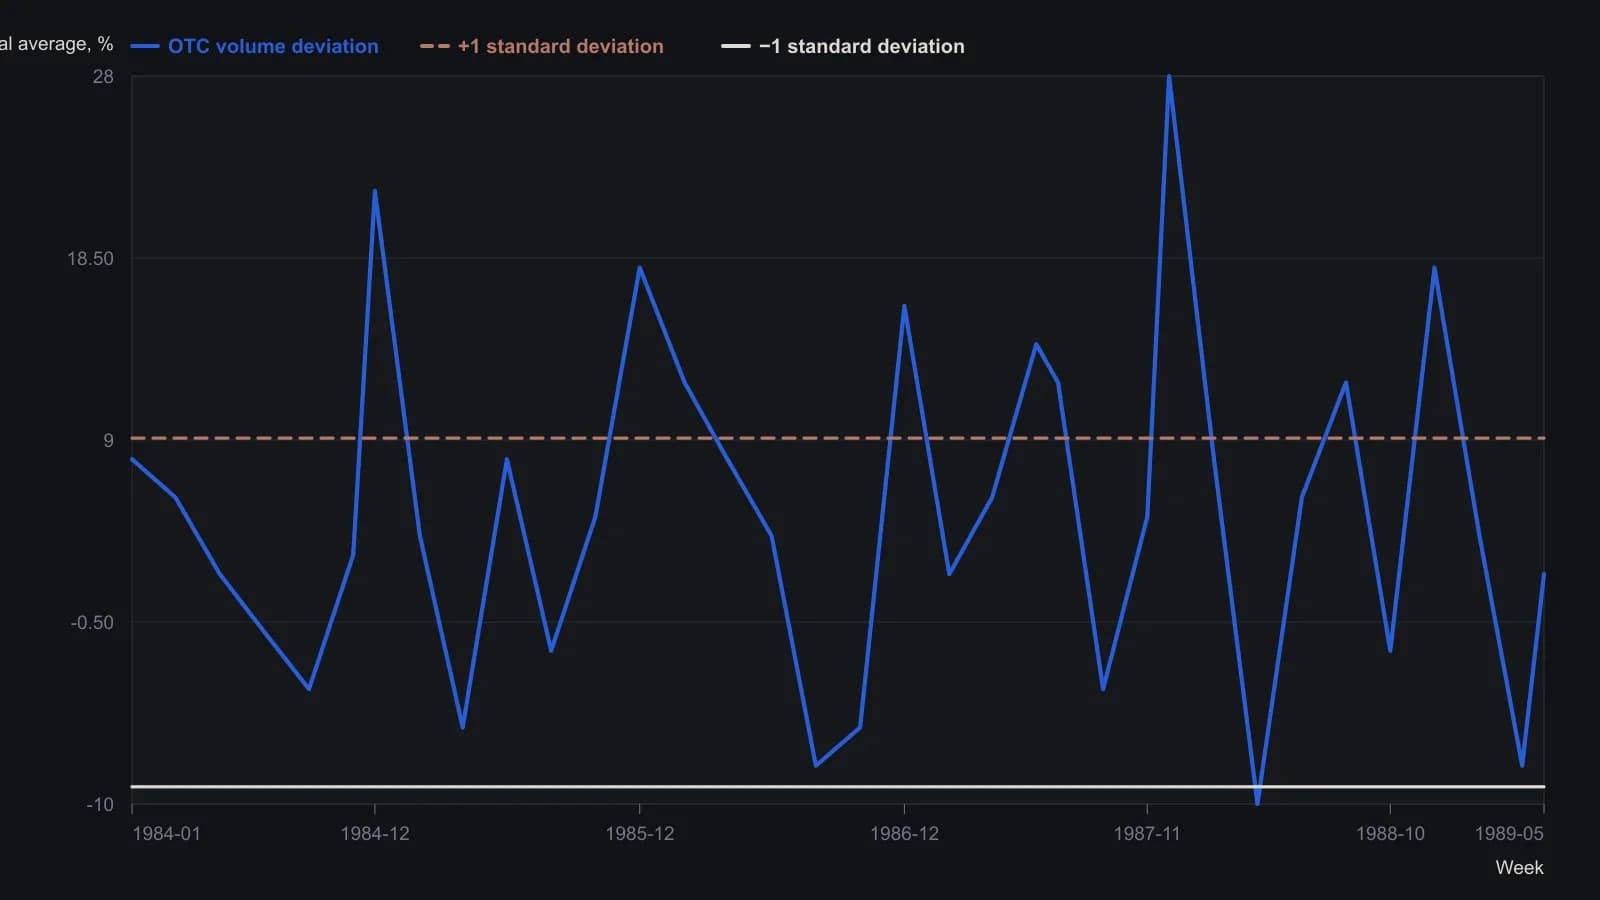
Weekly series plotted as deviation from a 3.77% exponential average over five years so listing growth is not mistaken for heat. Year-end weeks were not excluded; the late-year lift is the seasonal effect Merrill flags. Digitized from the printed curve; about one point every five to six weeks, with year-end spikes kept. Y values are approximate to the nearest unit.
When the venues disagree, and why the window is weak
The two venue series did not stay aligned. One stretch was mostly low except for the year-end spike. Another was mixed. One period was elevated and later ran low. In another stretch the over-the-counter series rose while the secondary-listed series did not mark the same top.
The chart window used for the evaluation sat mostly inside a bull-market stretch, which the archive treats as a weak test of a speculation-breadth indicator.
All readings on this track · 41 readings
- 1989Evaluating venue volume as a speculation-breadth signal
- 1991A thirty-name price-weighted average as a seasonal regime classroom
- 1991Ranked half-year rate changes as an equity signal filter
- 1991Demographic wave as a market-regime overlay
- 1994Seasonal range regimes as a futures context overlay
- 1996Evaluating presidential party terms as equity regimes
- 1996A dominant cycle is a baseline, not a reprint
- 1996Seasonality and presidential election cycle regimes
- 1997Stacking calendar regimes around election years
- 1997Calendar seasonality as a testable trading procedure
- 1997Lunar phase delay as a testable seasonal regime
- 1998Seasonal system construction without curve-fitting
- 1999Crowd life cycle as a market regime map
- 2001Regime-dependent cycle timing after four-year and seasonal lows
- 2002A 2002 case study in regime-first seasonal selection
- 2002Seasonal windows and dominant-cycle rules
- 2002Fifty-four-year wholesale cycle as an inflation-deflation regime map
- 2004The championship conference rule as a yearly regime case study
- 2004Election-year seasonality as trade regime context
- 2006Two-ten inversion as an intermarket regime filter
- 2006Midterm-to-presidential seasonal holding window
- 2008Two-layer equity regimes from seasonality and price history
- 2008Seasonal futures as a regime filter, not a calendar rule
- 2008Retesting seasonal rules when regimes change
- 2010Corn and wheat staggered calendars as dollar-neutral seasonal spreads
- 2011Name the S&P 500 trend regime before using weekly and monthly seasonality
- 2012Seasonal windows that wait for confirmation
- 2013Pair-sleeve rotation as a two-state sector regime-switch
- 2013Lunar phase as a seasonal overlay on implied volatility
- 2013Soybean seasonal highs in a five-year carryover regime
- 2014Year-end tax-loss selling as a seasonal regime
- 2017Calendar-window overlays that mute mechanical signals without rewriting the system
- 2017A four-year cycle and volume case study of a secular bear
- 2017Treat the valuation climate as climate and implied-volatility extremes as weather
- 2019Seasonal depth versus tracking for futures position sizing
- 2019Stacking cycle forecasts with seasonal regimes
- 2019Hit-rate gates for seasonal regime evaluation
- 2019July to October as a seasonal window, not a reason to own the name
- 2020A recession-regime checklist from valuation stretch and the yield curve
- 2020Treat a seasonal idea as a stay-or-sit holding procedure
- 2020A single position as a sleeve on a seasonal regime map