2002issue C091-4
Fifty-four-year wholesale cycle as an inflation-deflation regime map
A 54-year wholesale-price rhythm is dated first as an inflation-versus-deflation calendar. A shorter Elliott structure on the same commodity series is then checked for agreement, and only after that is a war, recession, or paper-asset boom placed inside a seasonal-style regime.
- Treat the 54-year wholesale-price rhythm as a dominant-cycle calendar that sequences inflationary highs, a short post-peak contraction, a milder middle plateau, and a later trough, and read price as a function of time rather than as short-run supply and demand.
- Use the peak-versus-trough-war contrast before calling wartime a cycle signal: peak-linked wars in 1814, 1865, 1920, and 1972 sit at inflation climaxes, while trough wars in 1846, 1897, and 1942 sit with unused resources, low prices, low debt, and low rates.
- On the later commodity series, test whether a five-wave elliott-wave pennant and reflex double bottom agree with a long-wave-plateau of sideways digestion rather than a collapse.
- Only then apply seasonality-analysis: judge a recession or paper-asset boom against inflation, plateau, or deflation weather, including the commodity-paper-seesaw after 1982.
Price as a function of time
The source treats a 54-year wholesale-price rhythm as the dominant cycle of wave economics and argues that price should be read as a function of time rather than as short-run supply and demand.
That 54-year pulse is framed as an inflation-deflation beat in wholesale prices that also organizes politics, culture, and wartime. In this usage, dominant-cycle means a 54-year wholesale-price rhythm used as a long-horizon baseline that sequences inflationary highs, a short post-peak contraction, a milder middle plateau, and a later trough.
Date the wholesale-price calendar first
Peak-linked wars in the supplied timeline fall in 1814, 1865, 1920, and 1972. Each is treated as a climax to about two prior decades of tension and inflation and then followed by a sharp but usually short recession.
The longest United States depressions in the supplied examples arrive about 10 years after those peaks, dated 1825, 1874, and 1929 and lasting four, five, and four years. They then give way to about 15 years of broader deflation into the trough.
Commodity history is presented as repeating timed advances in 1914 to 1920 and 1972 to 1980 on the 54-year timetable. A post-October 1980 deflationary recession in producing industries is then used as a road map toward a trough near 2000.
Keep wars on the inflation-deflation beat
Wars at troughs are distinguished from wars at peaks. Trough wars are placed in settings of unused resources, low prices, low debt, and low rates, with the supplied trough-war dates 1846, 1897, and 1942.
Peak-versus-trough-war is that contrast: wars that arrive as climaxes to inflationary expansion versus wars that arrive amid unused resources, low prices, low debt, and low rates. The contrast is a calendar test, not a standalone wartime signal.
Check a shorter Elliott structure for agreement
The later commodity series is read as an almost two-decade sideways plateau forming a five-wave Elliott pennant and a reflex double bottom. Farm price supports and new East Asian demand are offered as reasons the pattern stayed flat instead of collapsing.
In this usage, elliott-wave means a five-wave contracting pennant read on a multi-year commodity chart as sideways digestion rather than a collapse, and tested as a falsifiable chart condition.
Editorial: agreement with the long calendar would mean the pennant sits in the long-wave-plateau, the middle interval after a brief post-peak recession, when deflation is described as mild, long-term rates ease, and business can look prosperous even while the next liquidation phase is already on the calendar. A mismatch would weaken the claim that the same event is cycle proof.
CRB cash index, quarterly, 1972–2002
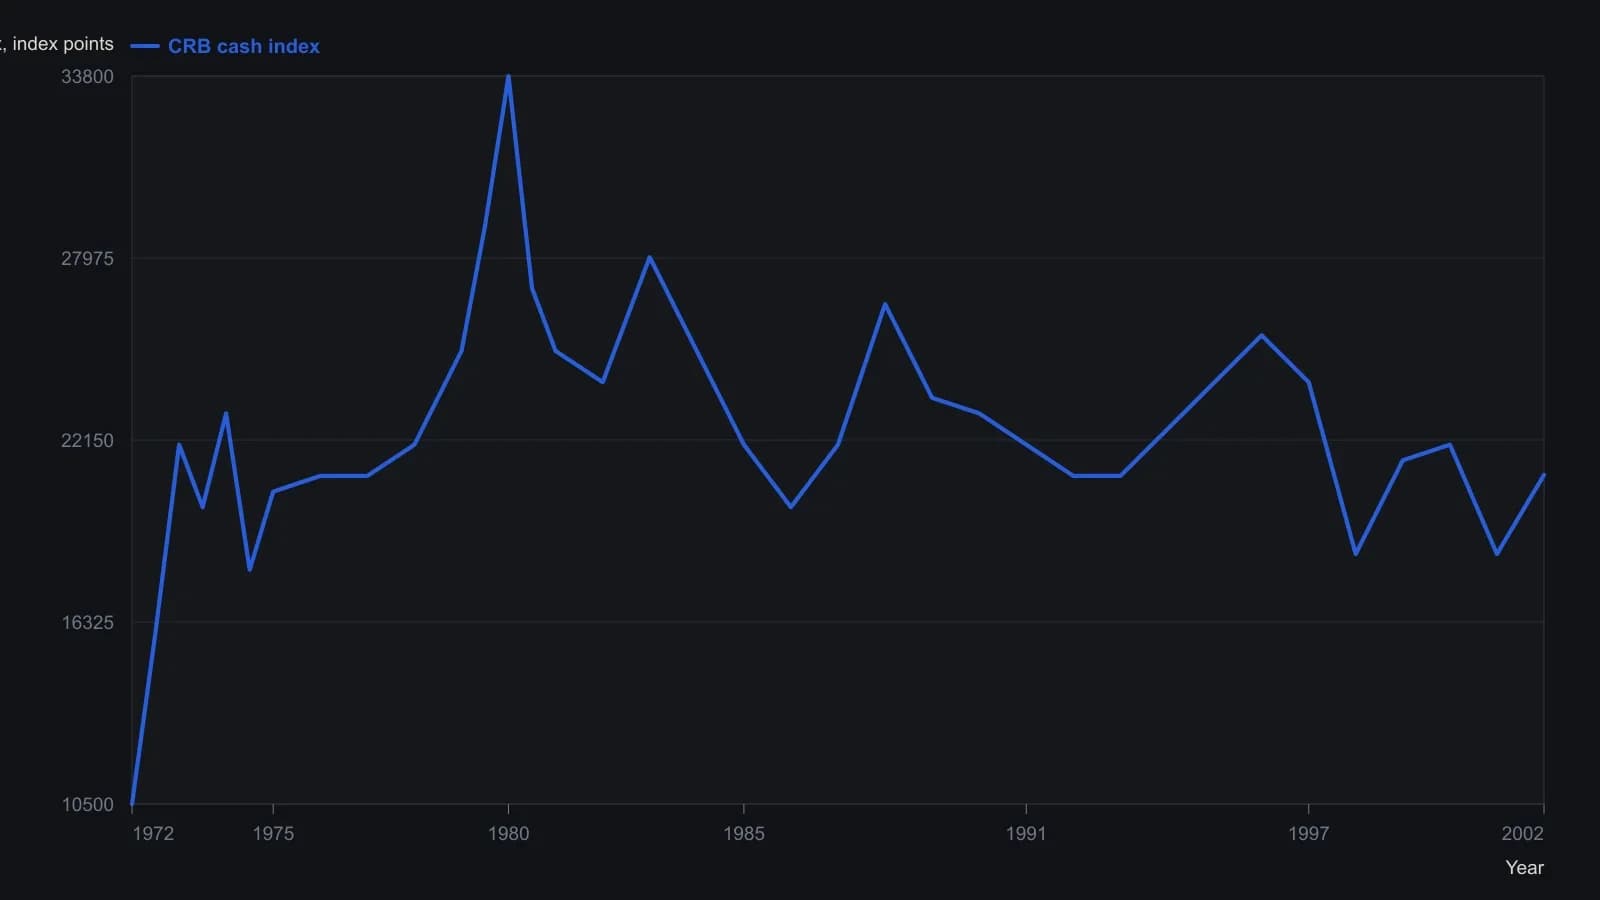
All points except the printed last of 21034 are digitized from the CQG quarterly bar raster and rounded to the nearest 500 index points; an unlabeled smooth overlay on the same pane is omitted.
Read the plateau as seasonal-style weather
The same plateau is used as a seasonal-style regime. After 1982, easier rates and drifting wholesale prices coincide with inflation in paper assets, described as a seesaw that lifts financial claims while relative commodity prices sit at a historic low.
Seasonality-analysis here is a regime map that treats inflation decades, plateau decades, and deflation decades as recurring market weather, so a single price move is judged against the phase rather than in isolation.
The commodity-paper-seesaw is a teaching image in which drifting wholesale prices and cheaper money sit opposite rising stocks and bonds, so paper claims can inflate while material prices stay relatively depressed.
Editorial: a paper-asset boom in that weather is not standalone proof that the 54-year cycle has changed. It is a phase reading on the same calendar, taken only after the long wholesale-price dating and the shorter Elliott check.
All readings on this track · 41 readings
- 1989Evaluating venue volume as a speculation-breadth signal
- 1991A thirty-name price-weighted average as a seasonal regime classroom
- 1991Ranked half-year rate changes as an equity signal filter
- 1991Demographic wave as a market-regime overlay
- 1994Seasonal range regimes as a futures context overlay
- 1996Evaluating presidential party terms as equity regimes
- 1996A dominant cycle is a baseline, not a reprint
- 1996Seasonality and presidential election cycle regimes
- 1997Stacking calendar regimes around election years
- 1997Calendar seasonality as a testable trading procedure
- 1997Lunar phase delay as a testable seasonal regime
- 1998Seasonal system construction without curve-fitting
- 1999Crowd life cycle as a market regime map
- 2001Regime-dependent cycle timing after four-year and seasonal lows
- 2002A 2002 case study in regime-first seasonal selection
- 2002Seasonal windows and dominant-cycle rules
- 2002Fifty-four-year wholesale cycle as an inflation-deflation regime map
- 2004The championship conference rule as a yearly regime case study
- 2004Election-year seasonality as trade regime context
- 2006Two-ten inversion as an intermarket regime filter
- 2006Midterm-to-presidential seasonal holding window
- 2008Two-layer equity regimes from seasonality and price history
- 2008Seasonal futures as a regime filter, not a calendar rule
- 2008Retesting seasonal rules when regimes change
- 2010Corn and wheat staggered calendars as dollar-neutral seasonal spreads
- 2011Name the S&P 500 trend regime before using weekly and monthly seasonality
- 2012Seasonal windows that wait for confirmation
- 2013Pair-sleeve rotation as a two-state sector regime-switch
- 2013Lunar phase as a seasonal overlay on implied volatility
- 2013Soybean seasonal highs in a five-year carryover regime
- 2014Year-end tax-loss selling as a seasonal regime
- 2017Calendar-window overlays that mute mechanical signals without rewriting the system
- 2017A four-year cycle and volume case study of a secular bear
- 2017Treat the valuation climate as climate and implied-volatility extremes as weather
- 2019Seasonal depth versus tracking for futures position sizing
- 2019Stacking cycle forecasts with seasonal regimes
- 2019Hit-rate gates for seasonal regime evaluation
- 2019July to October as a seasonal window, not a reason to own the name
- 2020A recession-regime checklist from valuation stretch and the yield curve
- 2020Treat a seasonal idea as a stay-or-sit holding procedure
- 2020A single position as a sleeve on a seasonal regime map