2008issue C111-2
Retesting seasonal rules when regimes change
A calendar slogan or a diversification claim can look orderly in a long sample and still fail in the windows that threaten a portfolio. Split the claim into an average-period test, a large-move-day test, and a rerun after the idea became common knowledge.
- Treat a calendar or diversification slogan as three checks: an average-period test, a large-move-day test, and a rerun after the idea became common knowledge.
- Average-period diversification can miss stress-day correlation, when loosely related holdings move together on very large equity swings.
- Weekday seasonality can reverse after a later sample, and a weak seasonal average can be outlier-driven rather than typical.
- A geographic regime hedge and a calendar abstention rule can fail in the same windows that threaten a portfolio.
Three checks, not one slogan
A popular calendar or diversification slogan can look tidy across a long sample and still fail in the windows that threaten a portfolio. Editorial reading: do not treat the slogan as one blended story. Split it into three separate checks.
The first check is an average-period test: what happens on typical days. The second is a large-move-day test: what happens on sessions with unusually large swings. The third is a rerun after the idea became common knowledge, which can show publication decay.
Average-period diversification and stress-day correlation
Pairs that show little long-run co-movement, including gold versus crude and stocks from different industries, often move in the same direction on days of very large equity swings. That pattern is stress-day correlation.
When a major industrial average falls 3% in a session, nearly all stocks tend to decline, so ordinary diversification does little to limit damage on that day. Average-period diversification infers risk reduction from low long-run co-movement measured across typical days rather than crash sessions. Editorial reading: the average-period test and the large-move-day test can disagree.
Demand labeled recession-resistant for tobacco, alcohol, and gambling is not guaranteed. Higher costs can cut consumption, and a 2008 credit review downgraded 17 casino companies as revenues weakened with the economy.
The geographic regime hedge
A geographic regime hedge is the assumption that non-domestic markets will offset a domestic decline because they occupy a different country basket. In the first half of 2008 a broad U.S. equity index fell 12.8%, a developed-world index fell 11.7%, and an emerging-markets index fell 12.7%, leaving little geographic offset in that window.
After currency adjustment, that same 2008 first-half window still showed declines in all major world markets except two. Editorial reading: a country-basket story that holds on average-period days can fail the large-move-day test in a shared decline.
Weekday seasonality and publication decay
Weekday seasonality is a calendar pattern in which days of the week differ in how often prices rise or in how much of the sample’s total change they contribute. A weekday test of a U.S. industrial average from 1900 found Monday closes higher only 35.8% of the time, while about half of the total points gained over 108 years still occurred on Mondays.
Extending a mid-1980s weekday study through June 2008 reversed the ranking: Mondays rose 57.6% of the time and Fridays 51.6% over 22 years. Publication decay is the fading or reversal of a documented seasonal ranking once the sample is extended past the original study. Editorial reading: frequency, contribution, and a later-window ranking are three different results. Do not fold them into one weekday slogan.
DJIA weekday win rates before and after the Monday rule was published
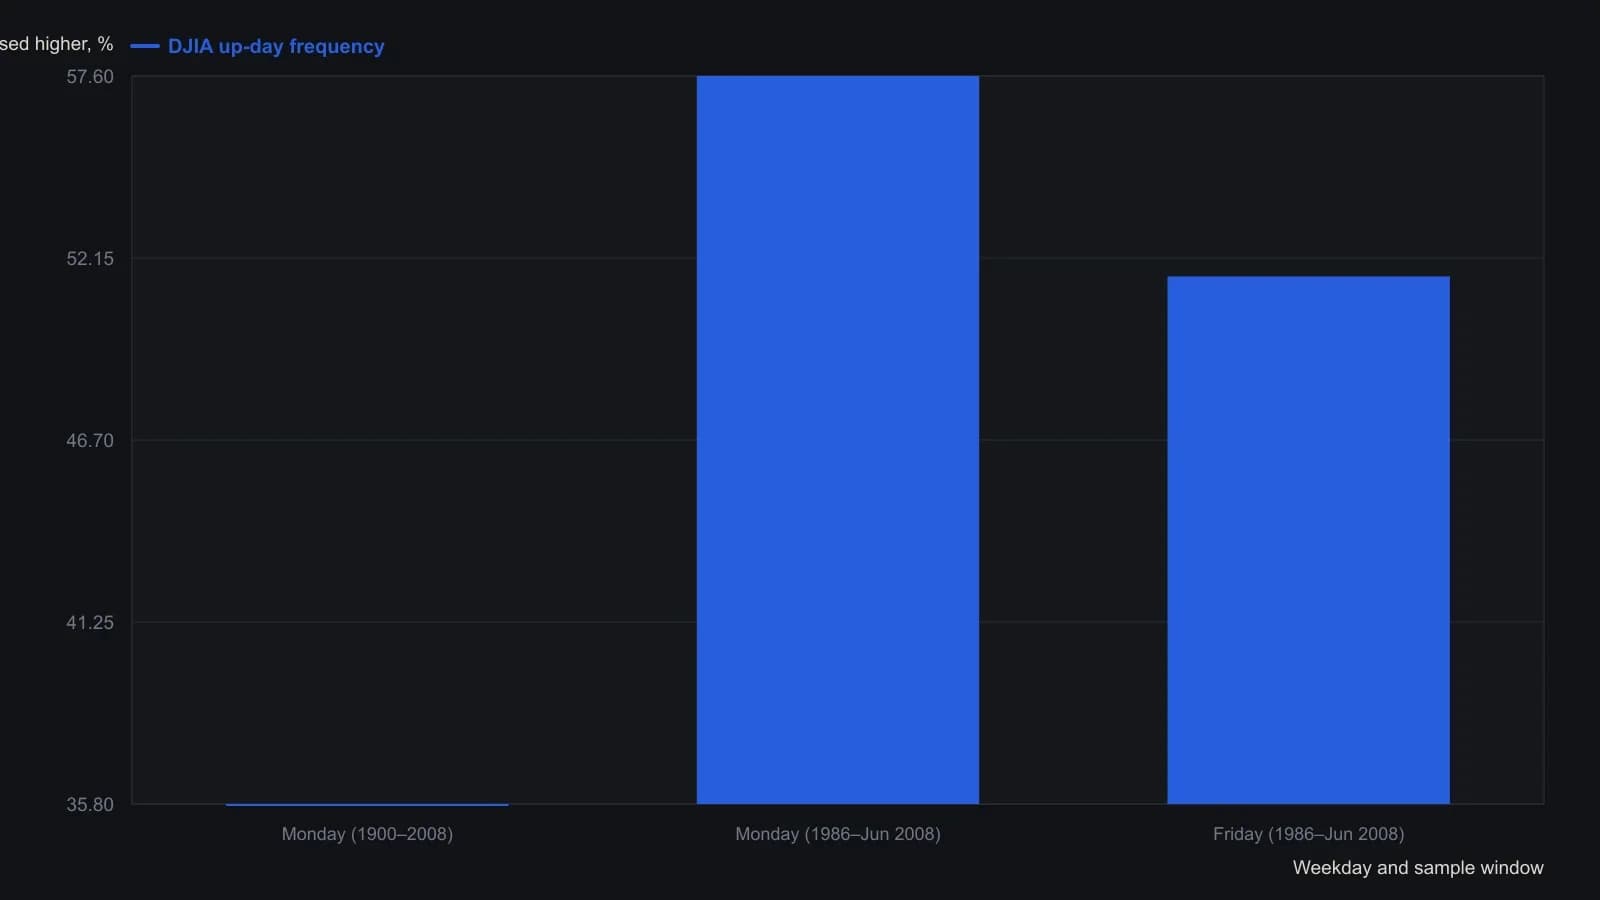
The long sample is DJIA back to 1900 (about 108 years). The rerun is 1986 through June 2008, after Hirsch published. Tuesday, Wednesday, and Thursday frequencies are not given in either window.
Outlier-driven seasonality and the calendar abstention rule
The late-spring through autumn window still produced gains more than 60% of the time. The weak seasonal average was largely the product of a few large-loss years rather than a typical six-month outcome. That is outlier-driven seasonality: a seasonal average that looks weak or strong mainly because a few extreme windows dominate the mean, not because most periods share that outcome.
A calendar abstention rule is a seasonal-trading procedure that stays out of the market during a fixed date window instead of holding through that window. A May-exit calendar rule did not beat a continuous hold in tests until 1987, a year that included a 22% single-day October drop, with later concentrated summer-to-autumn declines of about 17% and more than 20% also dominating the average.
Keep the three results apart
Editorial reading: an average-period test can make a calendar abstention rule or a geographic regime hedge look orderly. A large-move-day test can show stress-day correlation and outlier-driven seasonality instead. A rerun after the idea became common knowledge can show publication decay in weekday seasonality. Report the three checks separately so a long-sample mean does not hide the windows that actually threaten a portfolio.
All readings on this track · 41 readings
- 1989Evaluating venue volume as a speculation-breadth signal
- 1991A thirty-name price-weighted average as a seasonal regime classroom
- 1991Ranked half-year rate changes as an equity signal filter
- 1991Demographic wave as a market-regime overlay
- 1994Seasonal range regimes as a futures context overlay
- 1996Evaluating presidential party terms as equity regimes
- 1996A dominant cycle is a baseline, not a reprint
- 1996Seasonality and presidential election cycle regimes
- 1997Stacking calendar regimes around election years
- 1997Calendar seasonality as a testable trading procedure
- 1997Lunar phase delay as a testable seasonal regime
- 1998Seasonal system construction without curve-fitting
- 1999Crowd life cycle as a market regime map
- 2001Regime-dependent cycle timing after four-year and seasonal lows
- 2002A 2002 case study in regime-first seasonal selection
- 2002Seasonal windows and dominant-cycle rules
- 2002Fifty-four-year wholesale cycle as an inflation-deflation regime map
- 2004The championship conference rule as a yearly regime case study
- 2004Election-year seasonality as trade regime context
- 2006Two-ten inversion as an intermarket regime filter
- 2006Midterm-to-presidential seasonal holding window
- 2008Two-layer equity regimes from seasonality and price history
- 2008Seasonal futures as a regime filter, not a calendar rule
- 2008Retesting seasonal rules when regimes change
- 2010Corn and wheat staggered calendars as dollar-neutral seasonal spreads
- 2011Name the S&P 500 trend regime before using weekly and monthly seasonality
- 2012Seasonal windows that wait for confirmation
- 2013Pair-sleeve rotation as a two-state sector regime-switch
- 2013Lunar phase as a seasonal overlay on implied volatility
- 2013Soybean seasonal highs in a five-year carryover regime
- 2014Year-end tax-loss selling as a seasonal regime
- 2017Calendar-window overlays that mute mechanical signals without rewriting the system
- 2017A four-year cycle and volume case study of a secular bear
- 2017Treat the valuation climate as climate and implied-volatility extremes as weather
- 2019Seasonal depth versus tracking for futures position sizing
- 2019Stacking cycle forecasts with seasonal regimes
- 2019Hit-rate gates for seasonal regime evaluation
- 2019July to October as a seasonal window, not a reason to own the name
- 2020A recession-regime checklist from valuation stretch and the yield curve
- 2020Treat a seasonal idea as a stay-or-sit holding procedure
- 2020A single position as a sleeve on a seasonal regime map