1994issue C121-5
Seasonal range regimes as a futures context overlay
Archive notes summarized domestic futures as one monthly barometer of aggregate trading-range change. Editorial reading: treat that seasonal-range-map as a regime-overlay around a live book, not as a switch that starts or stops the program.
- Domestic futures were summarized as one monthly barometer of aggregate range change, and range-expansion was treated as a prerequisite for trends of significant degree.
- The seasonal-range-map placed range-contraction in a spring tax-period lull, July and August vacation months, and a late-year holiday stretch, with expansion windows in the intervals between.
- Seasonal maps were not treated as a reason to halt trading. Exceptions were cited as the case for staying in the program and adding a sideways-safeguard.
- Expanding ranges were associated with fewer trades and larger vertical opportunity; contracting ranges with more trades and smaller opportunity.
A monthly barometer of the complex
Domestic futures markets were summarized as one monthly barometer of aggregate trading-range change rather than a weekly or daily measure. Range-expansion was treated as a prerequisite for trends of significant degree. Without that widening of aggregate ranges, those trends were described as absent.
Expanding ranges were associated with fewer trades and larger vertical opportunity. Range-contraction was associated with more trades and smaller opportunity.
Where the seasonal-range-map placed quiet and active months
Recurring contraction windows were tied to a spring tax-period lull, July and August vacation months, and a late-year holiday stretch from late November through year-end. Expansion windows were placed in the intervals between those contraction stretches, when vertical price movement becomes more available to trend-seeking methods across time frames.
On that seasonal-range-map, January, July, and August were classified as contraction months. February and March were classified as expansion months.
Monthly seasonal range of U.S. futures
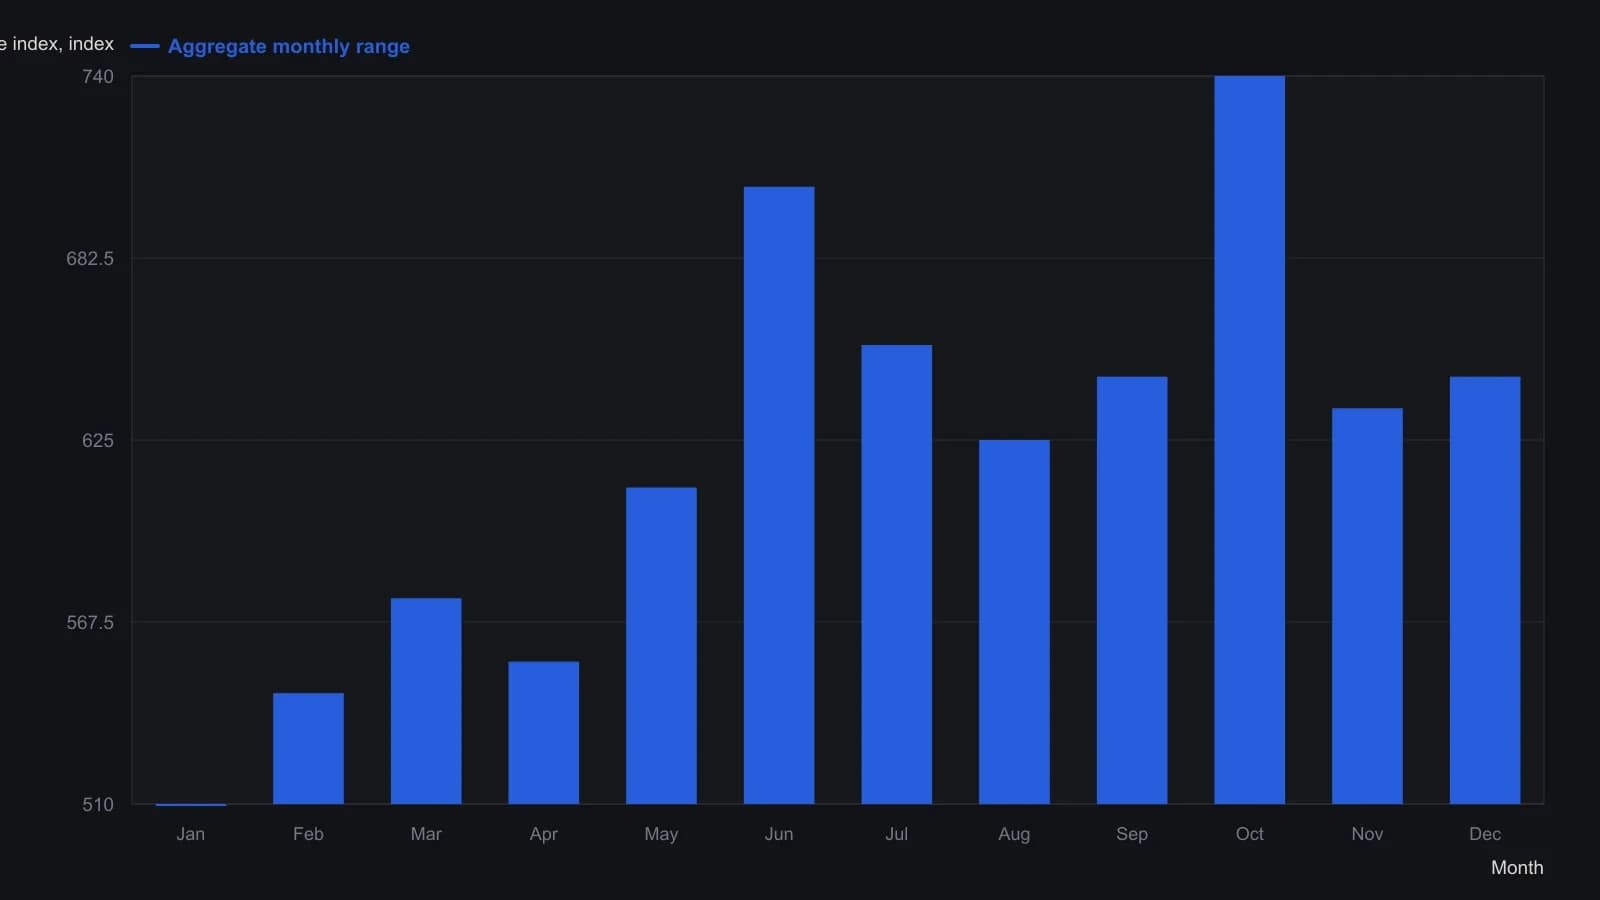
Y-axis ticks on the 1994 3-D original run from about 420 at the top rail down to 800; bars hang from that upper rail. Heights are approximate digitizations of a rotated column chart, so treat them as the shape of the seasonal map rather than exact index prints. Angle used this as a monthly barometer of all major U.S. futures, not a single contract.
Composite-alignment and the two exceptions
A month-to-month comparison used eight years of relative range-change data against six years of an industry managed-futures composite. In that composite-alignment, ten of twelve calendar months aligned in direction of change. April and September were the two exceptions.
Context around the book, not a halt rule
Seasonal maps were not treated as a reason to halt trading. Exceptions over a 15-year window were cited as the case for staying in the program and adding a sideways-safeguard instead.
Most programs were described as tied to major trends created by the price environment, so mixing books solely for noncorrelation was presented as harder than it first appears.
Editorial reading: a regime-overlay uses the calendar as context for an existing program. It does not replace process with a rule that starts or stops trading.
All readings on this track · 41 readings
- 1989Evaluating venue volume as a speculation-breadth signal
- 1991A thirty-name price-weighted average as a seasonal regime classroom
- 1991Ranked half-year rate changes as an equity signal filter
- 1991Demographic wave as a market-regime overlay
- 1994Seasonal range regimes as a futures context overlay
- 1996Evaluating presidential party terms as equity regimes
- 1996A dominant cycle is a baseline, not a reprint
- 1996Seasonality and presidential election cycle regimes
- 1997Stacking calendar regimes around election years
- 1997Calendar seasonality as a testable trading procedure
- 1997Lunar phase delay as a testable seasonal regime
- 1998Seasonal system construction without curve-fitting
- 1999Crowd life cycle as a market regime map
- 2001Regime-dependent cycle timing after four-year and seasonal lows
- 2002A 2002 case study in regime-first seasonal selection
- 2002Seasonal windows and dominant-cycle rules
- 2002Fifty-four-year wholesale cycle as an inflation-deflation regime map
- 2004The championship conference rule as a yearly regime case study
- 2004Election-year seasonality as trade regime context
- 2006Two-ten inversion as an intermarket regime filter
- 2006Midterm-to-presidential seasonal holding window
- 2008Two-layer equity regimes from seasonality and price history
- 2008Seasonal futures as a regime filter, not a calendar rule
- 2008Retesting seasonal rules when regimes change
- 2010Corn and wheat staggered calendars as dollar-neutral seasonal spreads
- 2011Name the S&P 500 trend regime before using weekly and monthly seasonality
- 2012Seasonal windows that wait for confirmation
- 2013Pair-sleeve rotation as a two-state sector regime-switch
- 2013Lunar phase as a seasonal overlay on implied volatility
- 2013Soybean seasonal highs in a five-year carryover regime
- 2014Year-end tax-loss selling as a seasonal regime
- 2017Calendar-window overlays that mute mechanical signals without rewriting the system
- 2017A four-year cycle and volume case study of a secular bear
- 2017Treat the valuation climate as climate and implied-volatility extremes as weather
- 2019Seasonal depth versus tracking for futures position sizing
- 2019Stacking cycle forecasts with seasonal regimes
- 2019Hit-rate gates for seasonal regime evaluation
- 2019July to October as a seasonal window, not a reason to own the name
- 2020A recession-regime checklist from valuation stretch and the yield curve
- 2020Treat a seasonal idea as a stay-or-sit holding procedure
- 2020A single position as a sleeve on a seasonal regime map