1996issue C071-9
A dominant cycle is a baseline, not a reprint
A historical cycles workflow isolated recurring intervals as forecast baselines and then asked whether later monetary and demographic settings still matched. This case study places any single seasonal pattern inside a broader market-context map instead of treating the past as a reprint.
- A dominant-cycle is an explicit forecast baseline, then compared with later windows rather than assumed to reprint.
- Seasonality-analysis compares calendar and decennial windows to describe a weeks-to-months market regime, not a standalone trade signal.
- Market-regime-classification groups prices, inflation sensitivity, policy constraints, and portfolio context so one cycle or seasonal pattern is read only inside that setting.
- The k-wave is a cautionary case: similar-looking commodity-price and interest-rate turns can belong to different regimes.
A catalog of intervals, not a finished map
A cycles research program founded in 1940 cataloged nearly 5,000 cycles across phenomena. Economic and financial-market series were the most heavily studied subset.
In that workflow a dominant-cycle is a recurring interval isolated from ordered price, volume, or breadth observations and used as an explicit quantitative baseline for a defined lookback and sampling horizon. Editorial interpretation: the baseline is the series later samples are compared with. It is not a claim that the next interval will copy the last one.
Long interest-rate and commodity waves
Interest-rate history extending to 3000 BC was presented as containing a 1,000-year cycle whose last millennium coincided with the rise and later breakdown of usury laws.
The Kondratieff wave was described as a 48-to-60-year sequence of commodity-price rises, recession, price stability, and depression, conventionally rounded to about 60 years. Here that long wave is the k-wave, a long commodity-price and interest-rate wave often treated as a 48-to-60-year economic cycle, and used as a cautionary case of mistaking similar-looking turns for the same regime.
Kondratieff's original window ran from just before the War of 1812 to just after World War I and was said to show three clear waves that do not appear elsewhere in that same dataset.
When the same wave fails on other charts
The same long wave was reclassified as mainly an agricultural commodity-price and interest-rate cycle, not a stock-market or whole-economy cycle, because secular trend and rate-of-change industrial-production charts do not display it.
Editorial interpretation: isolating a dominant-cycle on commodity prices and interest rates does not transfer that interval to equities or to the whole economy.
Policy settings that break a look-alike reading
Monetary-regime change was used to reject similarity-only cycle reading: a gold standard and intrinsically valued money in 1929 to 1932 versus a later floating-rate world in which the US dollar had lost 93% of purchasing power by 1996.
That step is market-regime-classification: grouping of market conditions by prices, inflation sensitivity, policy constraints, and portfolio context so a single cycle or seasonal pattern is interpreted only inside that setting.
Calendar windows belong on a market-context map
A decennial-election-year-pattern is a calendar-linked seasonal template for stocks that is checked against later out-of-sample windows rather than assumed to be permanent. It was reported as holding 19 out of 20 times since the late 1960s when shown against a detrended stock series. A detrended-series is a price or production series with the secular trend removed so shorter cycles and seasonal windows can be compared without trend bias.
Seasonality-analysis is comparison of calendar, decennial, or other recurring time windows across markets to describe a weeks-to-months market regime rather than a standalone trade signal.
Gold was described as usually leading CRB commodity-index turns, except in late 1992 when the index bottomed first and gold followed shortly after. Editorial interpretation: a familiar lead-lag order is still a context map, not a fixed sequence.
McClellan oscillator from NYSE breadth, May–June 1990
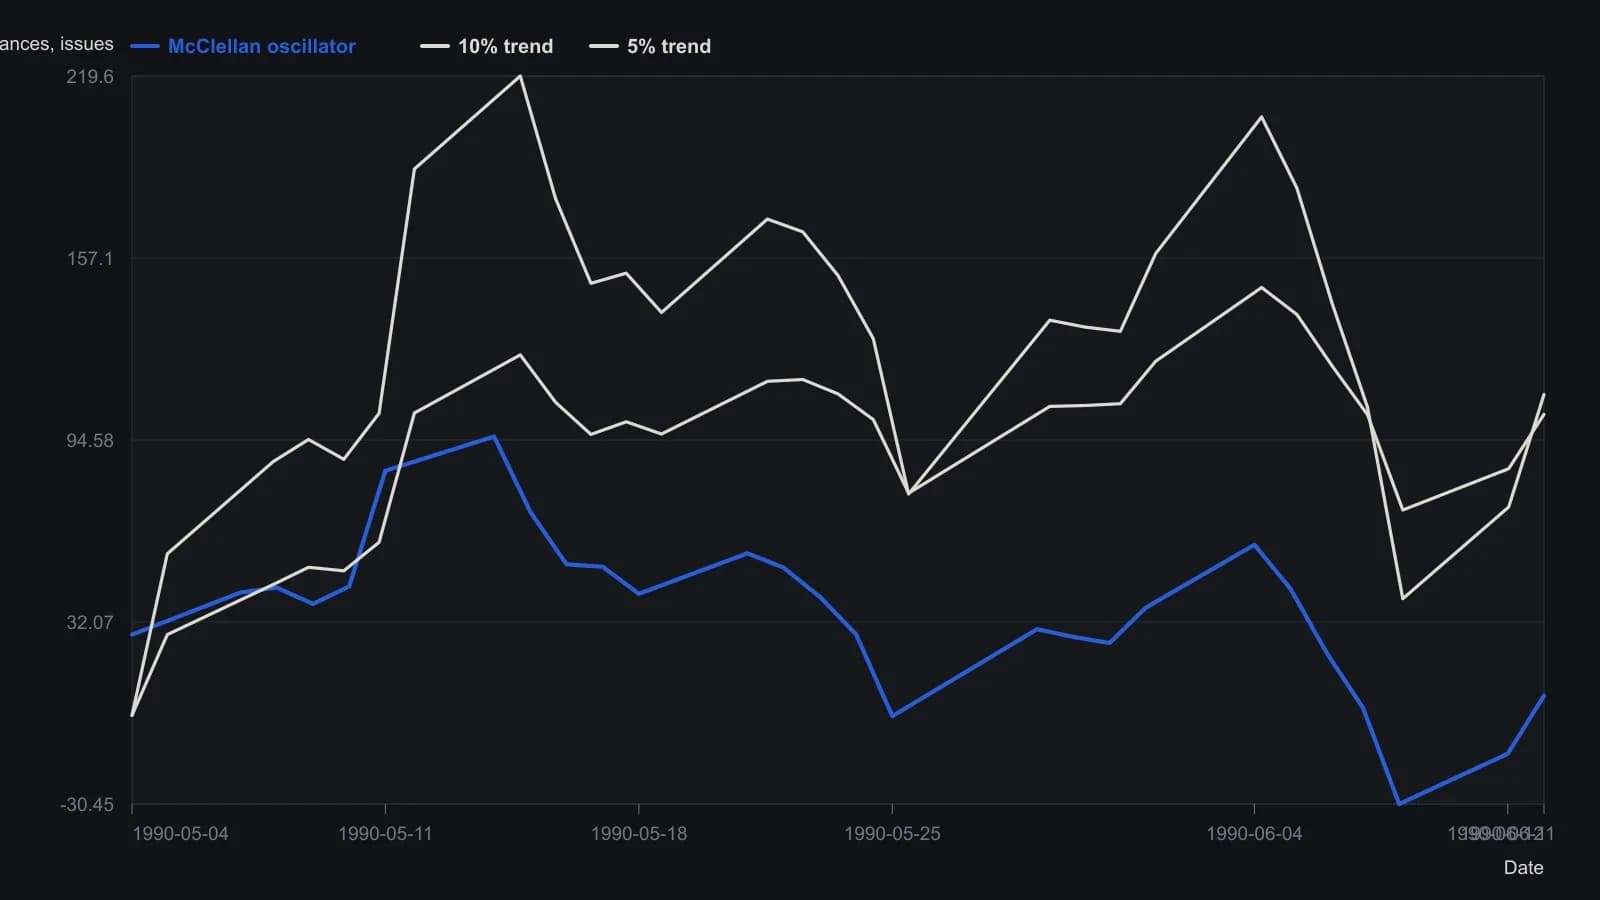
Both exponential averages are seeded at zero on 3 May 1990, as the McClellans recommend, so the oscillator begins on 4 May. The uncalibrated summation index and the 1000-neutral calibration sit on a much larger scale in the same sheet and are omitted here.
Shortage, inflation, and a missing demographic boom
A 1973 shortage-perception episode was cited as producing overproduction that then contributed to the 1974 recession, offered as a regime analog rather than a guaranteed repeat.
An inflation bout was expected in late 1997 or 1998 but classified as a different regime from 1970s inflation because a comparable demographic boom was absent.
Editorial interpretation: keep the dominant-cycle as the quantitative baseline, ask whether the monetary and demographic regime still matches, and only then place a seasonal window on the wider map.
All readings on this track · 41 readings
- 1989Evaluating venue volume as a speculation-breadth signal
- 1991A thirty-name price-weighted average as a seasonal regime classroom
- 1991Ranked half-year rate changes as an equity signal filter
- 1991Demographic wave as a market-regime overlay
- 1994Seasonal range regimes as a futures context overlay
- 1996Evaluating presidential party terms as equity regimes
- 1996A dominant cycle is a baseline, not a reprint
- 1996Seasonality and presidential election cycle regimes
- 1997Stacking calendar regimes around election years
- 1997Calendar seasonality as a testable trading procedure
- 1997Lunar phase delay as a testable seasonal regime
- 1998Seasonal system construction without curve-fitting
- 1999Crowd life cycle as a market regime map
- 2001Regime-dependent cycle timing after four-year and seasonal lows
- 2002A 2002 case study in regime-first seasonal selection
- 2002Seasonal windows and dominant-cycle rules
- 2002Fifty-four-year wholesale cycle as an inflation-deflation regime map
- 2004The championship conference rule as a yearly regime case study
- 2004Election-year seasonality as trade regime context
- 2006Two-ten inversion as an intermarket regime filter
- 2006Midterm-to-presidential seasonal holding window
- 2008Two-layer equity regimes from seasonality and price history
- 2008Seasonal futures as a regime filter, not a calendar rule
- 2008Retesting seasonal rules when regimes change
- 2010Corn and wheat staggered calendars as dollar-neutral seasonal spreads
- 2011Name the S&P 500 trend regime before using weekly and monthly seasonality
- 2012Seasonal windows that wait for confirmation
- 2013Pair-sleeve rotation as a two-state sector regime-switch
- 2013Lunar phase as a seasonal overlay on implied volatility
- 2013Soybean seasonal highs in a five-year carryover regime
- 2014Year-end tax-loss selling as a seasonal regime
- 2017Calendar-window overlays that mute mechanical signals without rewriting the system
- 2017A four-year cycle and volume case study of a secular bear
- 2017Treat the valuation climate as climate and implied-volatility extremes as weather
- 2019Seasonal depth versus tracking for futures position sizing
- 2019Stacking cycle forecasts with seasonal regimes
- 2019Hit-rate gates for seasonal regime evaluation
- 2019July to October as a seasonal window, not a reason to own the name
- 2020A recession-regime checklist from valuation stretch and the yield curve
- 2020Treat a seasonal idea as a stay-or-sit holding procedure
- 2020A single position as a sleeve on a seasonal regime map