2006issue C121-4
Midterm-to-presidential seasonal holding window
Archive notes measure a midterm-to-presidential window from each midterm November monthly close to the next presidential-election November close. Editorial reading: keep that span as one seasonal-trading procedure, then use four-year presidential-term regime detail to test for a year-two late low before the two-year hold is treated as a live signal.
- The midterm-to-presidential window is the two-year span from a midterm year's November monthly close to the November monthly close of the next presidential-election year.
- Editorial reading: write that window as one seasonal-trading procedure with a fixed November-to-November hold and an explicit stand-aside rule.
- Four-year presidential-term regime notes are used to ask whether a cycle is in a year-two late low before that hold is treated as a live signal.
- Weekly Dow Jones industrial charts of the 1994 and 2002 midterm lows, including crisis-coincident bottoms, illustrate the regime check rather than replace the two-year rule.
A fixed November-to-November window
A post-1950 survey of the Dow Jones industrials compared each midterm year's November monthly close with the November monthly close two years later in the presidential-election year. In that sample the later close was higher in every cycle.
The same November-to-November measurement was also applied to earlier twentieth-century cycles running from 1902-04 through 1946-48.
That span is the midterm-to-presidential window: a two-year measurement from the November monthly close of a midterm year to the November monthly close of the next presidential-election year.
One seasonal-trading procedure
A seasonal-trading procedure is a single testable set of entry, exit, and stand-aside rules whose holding period is that November-to-November window.
A 1952-2000 comparison contrasted an October-of-year-two entry held through the election-year close with a January-of-inaugural-year entry held through September of year two.
Editorial reading: those contrast windows show that the archive already isolated different holding spans. The procedure taught here remains the midterm-to-presidential window, not the October or January alternatives.
Presidential-term regime
The presidential-term regime is the four-year political calendar treated as a market-regime scaffold that can place one seasonal hold in a year-two, year-three, or year-four context.
A four-year political-cycle study split the presidential term into 16 three-month segments and described a typical path of first-half election-year softness, second-half strength, then about a year and a half of post-election decline into a mid-second-year low.
A year-by-year breakdown treated January through September of presidential year two as roughly flat since 1933 and located the start of many year-three advances in the fourth quarter of year two. An equity-cycle study covering 1942-44 through 2001-04 placed the average market low about 1.87 years into the presidential term, near mid-October of year two.
Those notes locate the year-two late low: the intra-term cluster in which many historical bottoms arrived near the fourth quarter of the second year of a presidential term.
A regime check before a live signal
Editorial reading: use the finer four-year seasonality as a test of presidential-term regime, not as a second trade. Before the November-to-November hold is treated as a live signal, ask whether the cycle sits in that year-two late-low cluster. If the path still resembles the long post-election decline, the seasonal-trading procedure can stand aside.
Midterm case charts
Weekly Dow Jones industrial charts were used as case studies of the 1994 and 2002 midterm lows, each framed as the start of a multi-year advance.
Cycle notes associated most bear-market starts and ends with the two years after presidential elections and listed midterm-year lows that arrived alongside widely watched social or geopolitical crises. A crisis-coincident bottom is a midterm-year low that historically often arrived while a social or geopolitical scare dominated public attention.
Editorial reading: the 1994 and 2002 charts are case studies of a year-two late low, sometimes arriving as a crisis-coincident bottom. They show how presidential-term regime context can confirm that a midterm-to-presidential window is opening. They do not replace the fixed November-to-November holding period.
DJIA weekly around the 2002 midterm low
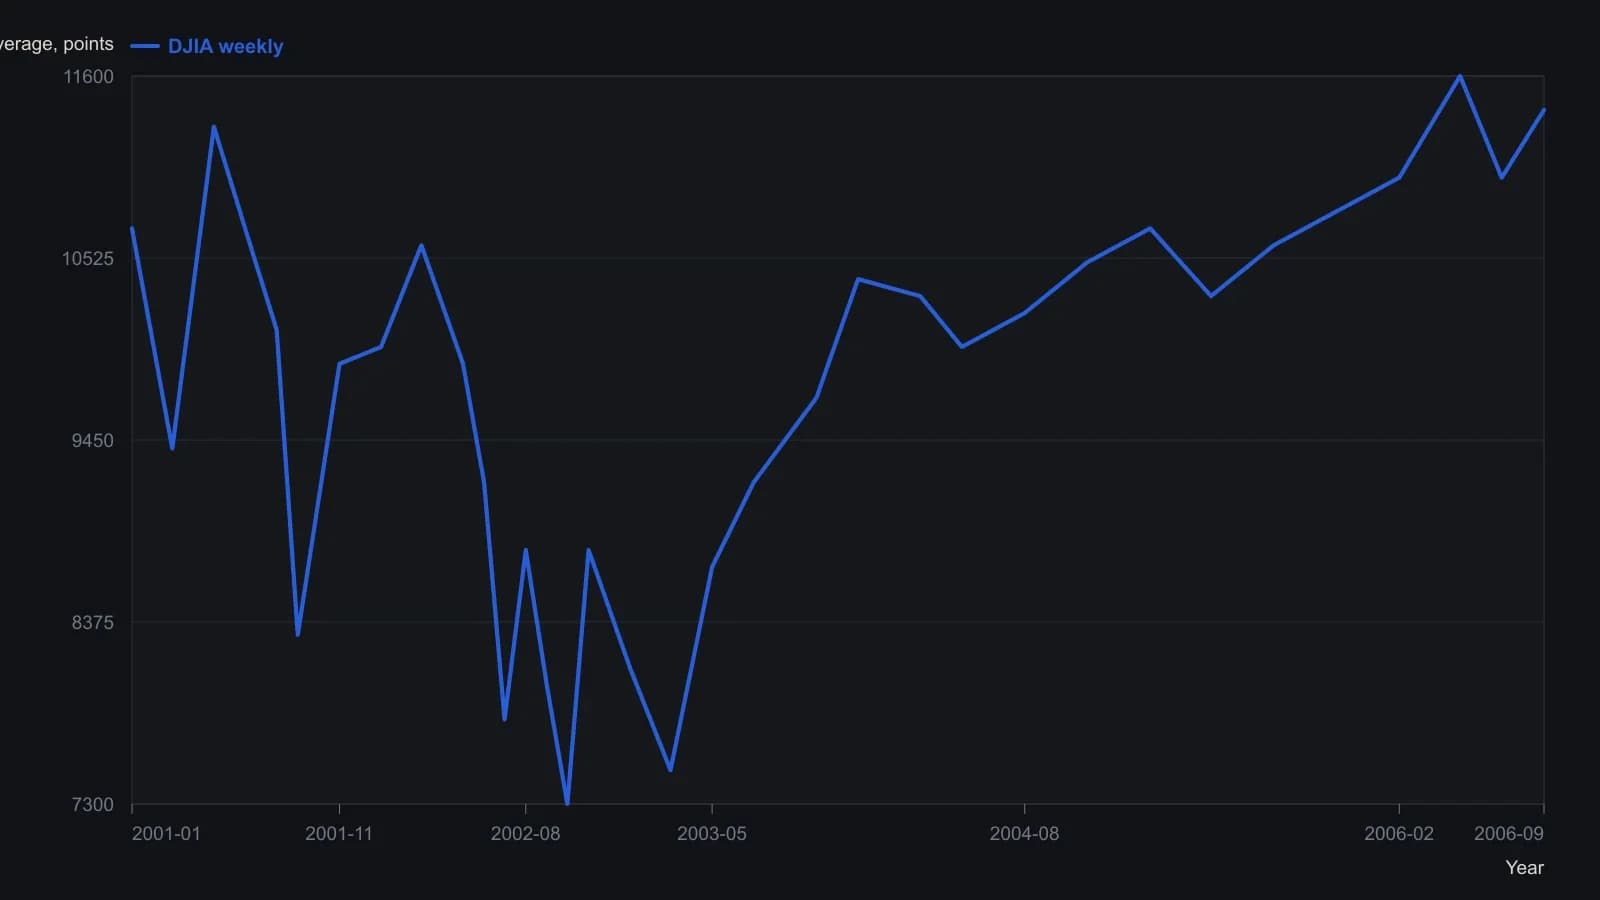
Read off the weekly raster and rounded to the nearest 100 points; the screenshot cannot support tighter precision. The yellow mark on the original sits on the late-2002 bounce after the October low. The header quote 11103.71 is the then-current print, not a point in this window.
All readings on this track · 41 readings
- 1989Evaluating venue volume as a speculation-breadth signal
- 1991A thirty-name price-weighted average as a seasonal regime classroom
- 1991Ranked half-year rate changes as an equity signal filter
- 1991Demographic wave as a market-regime overlay
- 1994Seasonal range regimes as a futures context overlay
- 1996Evaluating presidential party terms as equity regimes
- 1996A dominant cycle is a baseline, not a reprint
- 1996Seasonality and presidential election cycle regimes
- 1997Stacking calendar regimes around election years
- 1997Calendar seasonality as a testable trading procedure
- 1997Lunar phase delay as a testable seasonal regime
- 1998Seasonal system construction without curve-fitting
- 1999Crowd life cycle as a market regime map
- 2001Regime-dependent cycle timing after four-year and seasonal lows
- 2002A 2002 case study in regime-first seasonal selection
- 2002Seasonal windows and dominant-cycle rules
- 2002Fifty-four-year wholesale cycle as an inflation-deflation regime map
- 2004The championship conference rule as a yearly regime case study
- 2004Election-year seasonality as trade regime context
- 2006Two-ten inversion as an intermarket regime filter
- 2006Midterm-to-presidential seasonal holding window
- 2008Two-layer equity regimes from seasonality and price history
- 2008Seasonal futures as a regime filter, not a calendar rule
- 2008Retesting seasonal rules when regimes change
- 2010Corn and wheat staggered calendars as dollar-neutral seasonal spreads
- 2011Name the S&P 500 trend regime before using weekly and monthly seasonality
- 2012Seasonal windows that wait for confirmation
- 2013Pair-sleeve rotation as a two-state sector regime-switch
- 2013Lunar phase as a seasonal overlay on implied volatility
- 2013Soybean seasonal highs in a five-year carryover regime
- 2014Year-end tax-loss selling as a seasonal regime
- 2017Calendar-window overlays that mute mechanical signals without rewriting the system
- 2017A four-year cycle and volume case study of a secular bear
- 2017Treat the valuation climate as climate and implied-volatility extremes as weather
- 2019Seasonal depth versus tracking for futures position sizing
- 2019Stacking cycle forecasts with seasonal regimes
- 2019Hit-rate gates for seasonal regime evaluation
- 2019July to October as a seasonal window, not a reason to own the name
- 2020A recession-regime checklist from valuation stretch and the yield curve
- 2020Treat a seasonal idea as a stay-or-sit holding procedure
- 2020A single position as a sleeve on a seasonal regime map