2011issue C1034-39
Name the S&P 500 trend regime before using weekly and monthly seasonality
A historical S&P 500 workflow defined long-side calendar edges only after a 200-day simple moving average labeled the regime. Editorial view: weekly and monthly Seasonality analysis then belongs inside Seasonal trading as an abstention rule, not as a standalone timing clock.
- A day was treated as having a long-side edge only if it finished higher more than 53.4 percent of the time or posted a reward-risk ratio better than 1.01 versus the February 2001 to February 2011 S&P 500 baseline.
- A 200-day simple moving average labeled closes bullish or bearish before weekday or month-day statistics were applied.
- When the index closed below that average, no weekday met the long-side edge test; trading-day-of-month seasonality on active sessions was presented as a larger edge than weekday patterns once the same filter was used.
- Weekday seasonality can shift across decades, so the source advised periodic recalculation rather than treating any table as permanent.
A calendar edge was a defined test
A historical Seasonal trading workflow on the S&P 500 treated a day as having a long-side edge only if it finished higher more than 53.4 percent of the time or posted a reward-risk ratio better than 1.01 versus the February 2001 to February 2011 baseline.
Editorial view: those calendar slots should be read only after a trend regime is named. Seasonality analysis then ranks weekdays and month-days as permission or abstention, not as a clock that trades on its own.
Unfiltered weekdays were not the final table
In the unfiltered 2001 to 2011 weekday sample, Wednesday showed the strongest combination of up-day frequency and a 1.15 reward-risk ratio. Monday and Friday were the only weekdays with unfavorable long-side reward-risk ratios.
That unfiltered ranking was not the procedure. A 200-day simple moving average was used as the regime filter. Closes above it were labeled bullish and closes below it were labeled bearish before weekday or month-day statistics were applied.
The same weekdays flipped with the regime
When the S&P 500 closed above its 200-day average, Monday and Wednesday both posted up-move rates above 60 percent, and Monday's reward-risk ratio exceeded 2 to 1.
When the S&P 500 closed below its 200-day average, no weekday met the long-side edge test. Monday was instead described as a short-side candidate with about a 59 percent success rate and a reward-risk ratio near 1.6 to 1.
S&P 500 weekday up-close share by 200-day SMA regime
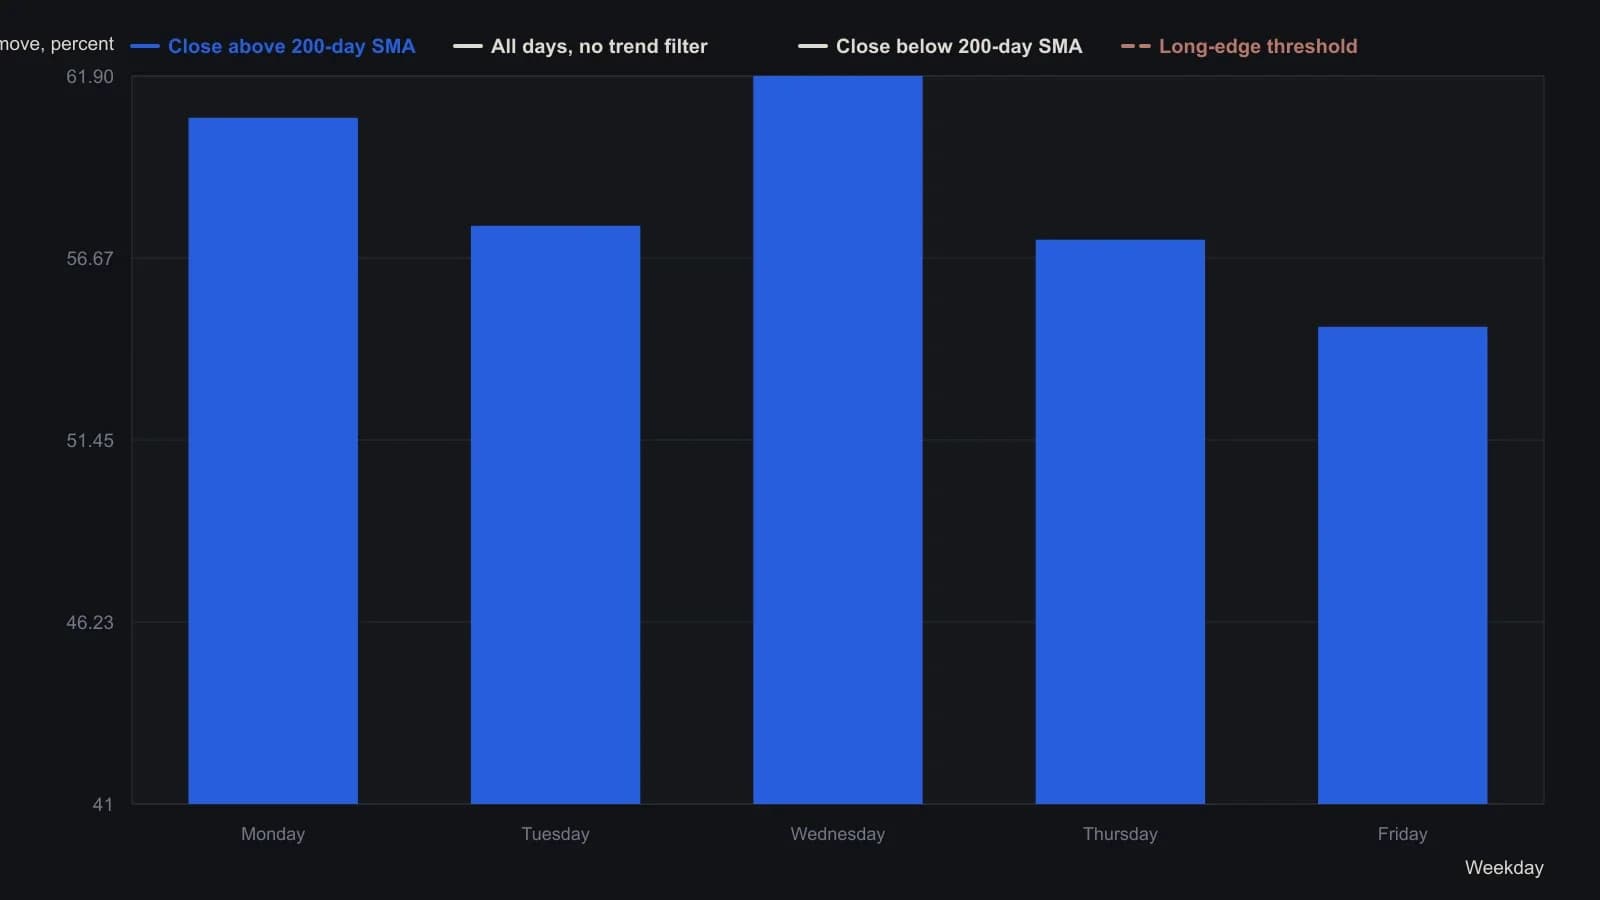
A day counted as a long-side edge only if it was up more than 53.4 percent of the time or had a reward-risk ratio above 1.01, measured against the unfiltered average day in the same window. Moves are close-to-close. The authors noted that weekday ranks shift across decades, so the 2001–2011 split is a historical procedure, not a permanent calendar.
Month-day tables used the same filter as a tiebreaker
Trading-day-of-month seasonality was defined on active sessions only, excluding weekends and holidays. Combined with the same trend filter, it was presented as a larger edge than weekday patterns.
The procedure used seasonality as a tiebreaker. Bullish-regime tables applied when price was above the 200-day average, bearish-regime tables when it was below, and the unfiltered tables when trend was judged neutral.
Weekday patterns were not treated as permanent
The source stated that weekday seasonality can shift across decades, citing a stronger Tuesday in the 1980s and early 1990s and more bearish Thursday episodes. It advised periodic recalculation rather than treating any table as permanent.
Editorial view: Seasonal trading is the single testable procedure here. The Moving average names the regime, Seasonality analysis ranks the calendar slots, and the usual output is often to stand aside.
All readings on this track · 41 readings
- 1989Evaluating venue volume as a speculation-breadth signal
- 1991A thirty-name price-weighted average as a seasonal regime classroom
- 1991Ranked half-year rate changes as an equity signal filter
- 1991Demographic wave as a market-regime overlay
- 1994Seasonal range regimes as a futures context overlay
- 1996Evaluating presidential party terms as equity regimes
- 1996A dominant cycle is a baseline, not a reprint
- 1996Seasonality and presidential election cycle regimes
- 1997Stacking calendar regimes around election years
- 1997Calendar seasonality as a testable trading procedure
- 1997Lunar phase delay as a testable seasonal regime
- 1998Seasonal system construction without curve-fitting
- 1999Crowd life cycle as a market regime map
- 2001Regime-dependent cycle timing after four-year and seasonal lows
- 2002A 2002 case study in regime-first seasonal selection
- 2002Seasonal windows and dominant-cycle rules
- 2002Fifty-four-year wholesale cycle as an inflation-deflation regime map
- 2004The championship conference rule as a yearly regime case study
- 2004Election-year seasonality as trade regime context
- 2006Two-ten inversion as an intermarket regime filter
- 2006Midterm-to-presidential seasonal holding window
- 2008Two-layer equity regimes from seasonality and price history
- 2008Seasonal futures as a regime filter, not a calendar rule
- 2008Retesting seasonal rules when regimes change
- 2010Corn and wheat staggered calendars as dollar-neutral seasonal spreads
- 2011Name the S&P 500 trend regime before using weekly and monthly seasonality
- 2012Seasonal windows that wait for confirmation
- 2013Pair-sleeve rotation as a two-state sector regime-switch
- 2013Lunar phase as a seasonal overlay on implied volatility
- 2013Soybean seasonal highs in a five-year carryover regime
- 2014Year-end tax-loss selling as a seasonal regime
- 2017Calendar-window overlays that mute mechanical signals without rewriting the system
- 2017A four-year cycle and volume case study of a secular bear
- 2017Treat the valuation climate as climate and implied-volatility extremes as weather
- 2019Seasonal depth versus tracking for futures position sizing
- 2019Stacking cycle forecasts with seasonal regimes
- 2019Hit-rate gates for seasonal regime evaluation
- 2019July to October as a seasonal window, not a reason to own the name
- 2020A recession-regime checklist from valuation stretch and the yield curve
- 2020Treat a seasonal idea as a stay-or-sit holding procedure
- 2020A single position as a sleeve on a seasonal regime map