1997issue C061-6
Lunar phase delay as a testable seasonal regime
An archive evaluation treats lunar phases as an external cyclic regime and encodes full-moon and new-moon events as a one-parameter long/short switch. The delay is searched until the pairing is market-specific, then judged by whether a lunar lock can be separated from a one-way trend or a simple end-of-month effect.
- The mechanical trading system buys a set number of bars after a full-moon event and sells the same number of bars after a new-moon event, with no other parameters, stops, or price filters.
- A delay of zero aligns buys with the full moon and sells with the new moon; a delay near 14 reverses that pairing, which is why the search ran from 1 to 20.
- Wheat selected delay 1, the NYFE composite selected delay 10, and silver selected delay 17, where entries clustered a few days after the new moon.
- A balanced long/short sample was used in place of a formal significance test on wheat, and the lunar lock is treated as a regime that can fade when another force dominates.
What was tested
The evaluation treats new, first-quarter, full, and last-quarter lunar phases as an external cyclic regime that might mark bottoms or tops. The idea is tested on several markets with end-of-day data.
A one-parameter switch
The mechanical trading system uses a single delay. It buys a set number of bars after a full-moon event and sells the same number of bars after a new-moon event. There are no other parameters, stops, or price filters. The mechanical trading system and the seasonal trading procedure are the same template: one delay, and no extra filters.
A delay of zero aligns buys with the full moon and sells with the new moon. A delay near 14 reverses that pairing to the opposite half of the lunar cycle.
How phase events are dated
Moon-phase dates come from an external function that takes a bar date and a phase code and returns the next date of that phase. The codes are 0 for new, 1 for first quarter, 2 for full, and 3 for last quarter. The procedure feeds the function the date from five bars earlier.
Overnight full-moon and new-moon events are flagged when the phase date falls between the current session date and the next session, including weekends.
Market-specific delays
The delay was searched from 1 to 20 so a reversed-phase solution near 14 could appear. Wheat selected delay 1, the NYFE composite selected delay 10, and silver selected delay 17.
At silver's selected delay of 17, entries clustered a few days after the new moon and exits a few days after the full moon. Buy dates drifted relative to calendar month-starts. That drift was used to argue against a simple end-of-month effect.
Wheat daily price under a one-day lunar delay
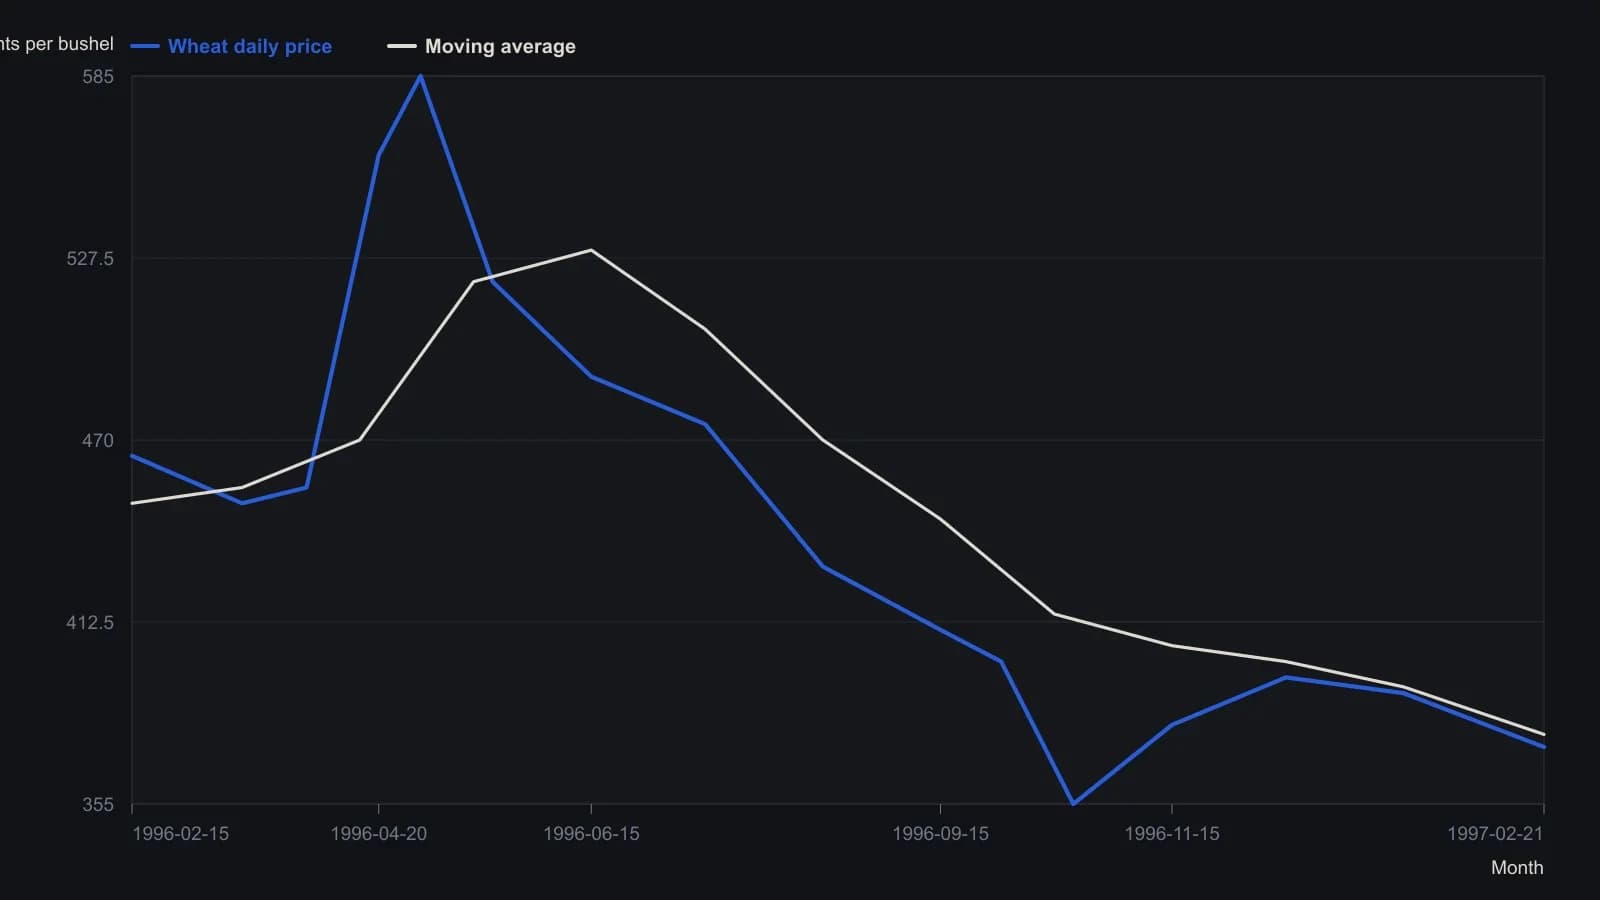
Delay L1 equals 1. Market orders only, no stops. Digitized levels are approximate to about five cents except the header close. The sample window on this figure is the last year of the 1990–1997 test, not the full run.
Competing drivers and a fading lock
Because the system alternates long and short in equal counts and similar time in market, a one-way price trend cannot by itself explain both sides of the sample. The wheat evaluation did not include formal tests of statistical significance. The case for a lunar rhythm rested on a large, balanced long/short sample rather than a significance test.
The discussion treats the lunar rhythm as one of several possible driving regimes. When another force or a strong trend dominates, the lunar lock can fade. Seasonality analysis is then an evaluation problem: detect when that regime is present.
All readings on this track · 41 readings
- 1989Evaluating venue volume as a speculation-breadth signal
- 1991A thirty-name price-weighted average as a seasonal regime classroom
- 1991Ranked half-year rate changes as an equity signal filter
- 1991Demographic wave as a market-regime overlay
- 1994Seasonal range regimes as a futures context overlay
- 1996Evaluating presidential party terms as equity regimes
- 1996A dominant cycle is a baseline, not a reprint
- 1996Seasonality and presidential election cycle regimes
- 1997Stacking calendar regimes around election years
- 1997Calendar seasonality as a testable trading procedure
- 1997Lunar phase delay as a testable seasonal regime
- 1998Seasonal system construction without curve-fitting
- 1999Crowd life cycle as a market regime map
- 2001Regime-dependent cycle timing after four-year and seasonal lows
- 2002A 2002 case study in regime-first seasonal selection
- 2002Seasonal windows and dominant-cycle rules
- 2002Fifty-four-year wholesale cycle as an inflation-deflation regime map
- 2004The championship conference rule as a yearly regime case study
- 2004Election-year seasonality as trade regime context
- 2006Two-ten inversion as an intermarket regime filter
- 2006Midterm-to-presidential seasonal holding window
- 2008Two-layer equity regimes from seasonality and price history
- 2008Seasonal futures as a regime filter, not a calendar rule
- 2008Retesting seasonal rules when regimes change
- 2010Corn and wheat staggered calendars as dollar-neutral seasonal spreads
- 2011Name the S&P 500 trend regime before using weekly and monthly seasonality
- 2012Seasonal windows that wait for confirmation
- 2013Pair-sleeve rotation as a two-state sector regime-switch
- 2013Lunar phase as a seasonal overlay on implied volatility
- 2013Soybean seasonal highs in a five-year carryover regime
- 2014Year-end tax-loss selling as a seasonal regime
- 2017Calendar-window overlays that mute mechanical signals without rewriting the system
- 2017A four-year cycle and volume case study of a secular bear
- 2017Treat the valuation climate as climate and implied-volatility extremes as weather
- 2019Seasonal depth versus tracking for futures position sizing
- 2019Stacking cycle forecasts with seasonal regimes
- 2019Hit-rate gates for seasonal regime evaluation
- 2019July to October as a seasonal window, not a reason to own the name
- 2020A recession-regime checklist from valuation stretch and the yield curve
- 2020Treat a seasonal idea as a stay-or-sit holding procedure
- 2020A single position as a sleeve on a seasonal regime map