2012issue C0544-48
Seasonal windows that wait for confirmation
A seasonal proverb names the months. This archive case study treats autumn and spring dates as permission to look, then lets a momentum test confirm the switch, postpone it, or leave the holding unchanged.
- The unfiltered Sell in May calendar is the academic baseline, not the full two-trade procedure.
- On the candidate autumn and spring dates, macd-confirmation can start the switch, delay it, or withhold it.
- The invested window is a favorable-season whose length changes with market state. After a spring confirmation the procedure prefers cash.
- Seasonality-analysis checks the winter-strong, summer-weak pattern across many equity markets, while the holding itself is one index tracker.
A proverb is not a procedure
Sell in May is the unfiltered calendar baseline: leave around the start of May and return around the start of November. That proverb is easy to quote. It is not, by itself, an auditable seasonal-trading rule.
The archive workflow used later candidate dates instead. October 16 and April 20 were treated as dates to inspect the market, not as dates that forced a switch. If a moving-average convergence/divergence reading was still a sell on October 16, re-entry waited for the next buy. If the same tool was still a buy on April 20, the exit waited for the next sell.
TradersWeek editorial reading: the calendar is only permission to look. The auditable act is whether macd-confirmation confirms the switch, postpones it, or leaves the position unchanged.
A window whose length can change
That momentum filter was said to make the favorable-season last four to seven months. In some years the delayed spring exit arrived as late as late June. The favorable-season is the invested window that begins after an autumn confirmation and ends after a spring confirmation. The unfavorable-season is the reduced-exposure window after a spring confirmation, when the procedure prefers cash until an autumn confirmation.
Seasonal-analysis places that single long-only holding inside a year-long cash-flow and vulnerability regime instead of treating every month as equivalent. The winter-strong, summer-weak pattern was attributed to extra cash inflows from autumn fund distributions, year-end bonuses, retirement-plan contributions, and April tax refunds. After those inflows the market was described as more exposed to selling.
One index, many markets
Seasonality-analysis asks whether that winter-strong, summer-weak pattern appears across many equity markets, not only in one index. The archive states that an academic check found a Sell in May pattern in 36 of 37 markets, and that a seasonal investor is in the market only about half the time. Global markets were described as tending to move together through the annual seasonal pattern, bear-market phases, and shorter pullbacks.
Seasonal-procedure signals were taken from the Dow Jones Industrial Average. The intended holding was an index fund or exchange-traded fund that tracks that average. Seasonal investing was characterized as nearly mechanical and limited to two trades a year. Moving averages, support and resistance, oscillators, sentiment, and extra weight on buys in the favorable-season still occupied most of the technical work.
A reaction after the turn
Both the unfiltered calendar approach and the filtered procedure were described as trend-following reactions after reversals, not as forecasts of the next one or two years. Navigation remained tied to technical analysis and the annual seasonal regime.
Yearly returns of the seasonal timing strategy versus major US indexes
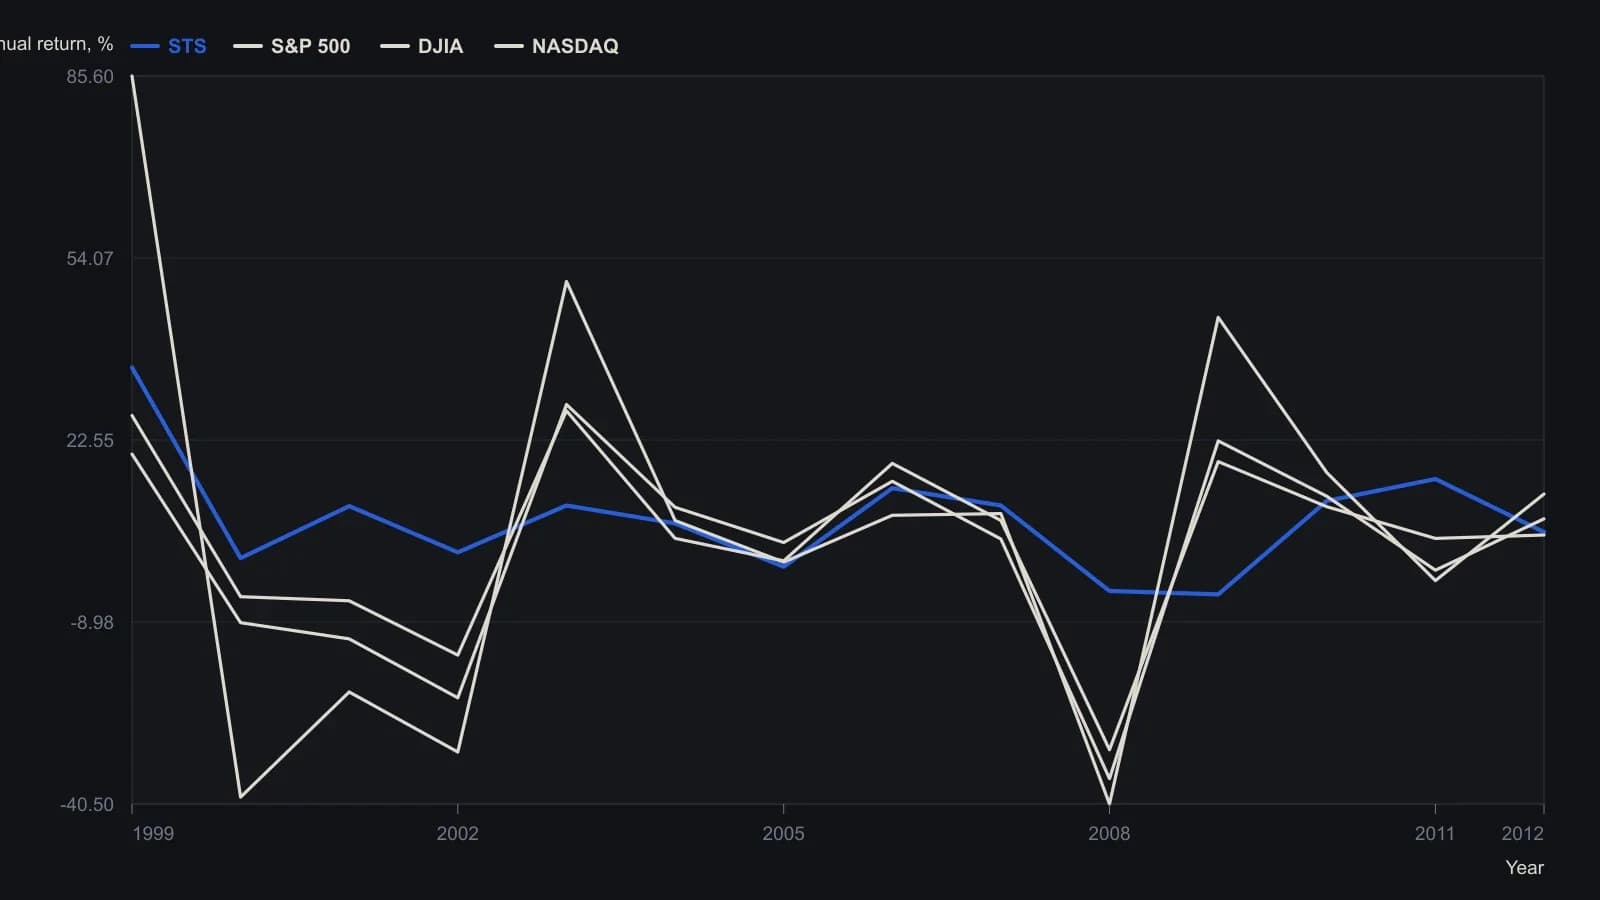
The 2012 row is year-to-date through 8 March 2012 rather than a completed calendar year. The S&P 500 entry for 2011 is recorded in the source as unchanged, shown here as 0.
All readings on this track · 41 readings
- 1989Evaluating venue volume as a speculation-breadth signal
- 1991A thirty-name price-weighted average as a seasonal regime classroom
- 1991Ranked half-year rate changes as an equity signal filter
- 1991Demographic wave as a market-regime overlay
- 1994Seasonal range regimes as a futures context overlay
- 1996Evaluating presidential party terms as equity regimes
- 1996A dominant cycle is a baseline, not a reprint
- 1996Seasonality and presidential election cycle regimes
- 1997Stacking calendar regimes around election years
- 1997Calendar seasonality as a testable trading procedure
- 1997Lunar phase delay as a testable seasonal regime
- 1998Seasonal system construction without curve-fitting
- 1999Crowd life cycle as a market regime map
- 2001Regime-dependent cycle timing after four-year and seasonal lows
- 2002A 2002 case study in regime-first seasonal selection
- 2002Seasonal windows and dominant-cycle rules
- 2002Fifty-four-year wholesale cycle as an inflation-deflation regime map
- 2004The championship conference rule as a yearly regime case study
- 2004Election-year seasonality as trade regime context
- 2006Two-ten inversion as an intermarket regime filter
- 2006Midterm-to-presidential seasonal holding window
- 2008Two-layer equity regimes from seasonality and price history
- 2008Seasonal futures as a regime filter, not a calendar rule
- 2008Retesting seasonal rules when regimes change
- 2010Corn and wheat staggered calendars as dollar-neutral seasonal spreads
- 2011Name the S&P 500 trend regime before using weekly and monthly seasonality
- 2012Seasonal windows that wait for confirmation
- 2013Pair-sleeve rotation as a two-state sector regime-switch
- 2013Lunar phase as a seasonal overlay on implied volatility
- 2013Soybean seasonal highs in a five-year carryover regime
- 2014Year-end tax-loss selling as a seasonal regime
- 2017Calendar-window overlays that mute mechanical signals without rewriting the system
- 2017A four-year cycle and volume case study of a secular bear
- 2017Treat the valuation climate as climate and implied-volatility extremes as weather
- 2019Seasonal depth versus tracking for futures position sizing
- 2019Stacking cycle forecasts with seasonal regimes
- 2019Hit-rate gates for seasonal regime evaluation
- 2019July to October as a seasonal window, not a reason to own the name
- 2020A recession-regime checklist from valuation stretch and the yield curve
- 2020Treat a seasonal idea as a stay-or-sit holding procedure
- 2020A single position as a sleeve on a seasonal regime map