2013issue C1363-68
Soybean seasonal highs in a five-year carryover regime
A drought-driven soybean rally is scored only after a five-year ending-stocks table and a concurrent equity-demand-regime sit beside the midsummer-high, so seasonal entry, an option-floor hedge, and abstention can be checked as one procedure.
- Treat tightness as a carryover-regime by comparing several years of ending-stocks, not by reading one season in isolation.
- Score a midsummer-high only after the grain balance-sheet is set beside the concurrent equity-demand-regime.
- Use old-crop prices as the near-term reference when a seasonal exit or option-floor is specified.
- Check seasonal entry, hedge, and abstention as one procedure, because neither price pattern nor inventory analysis alone was treated as sufficient.
A harvest trade as a regime test
A five-year soybean ending-stocks comparison was assembled after a drought-driven grain rally to test whether that season's projected carryover was the tightest print in the window.
Editorial reading: the case asks whether a midsummer-high can be scored before that print is placed inside a multi-year carryover-regime and a concurrent equity-demand-regime.
The five-year carryover table
US soybean ending-stock projections were recorded as 110 million bushels in 2008-09, 150 million in 2009-10, 225 million in 2010-11, 145 million in 2011-12, and a tentative 115 million in 2012-13.
World soybean ending-stock projections for the same five marketing years were recorded as 40.22, 62.85, 68.82, 51.94, and a tentative 55.66 million metric tons.
The 2012-13 US stock projection was treated as comparable to 2008-09, while world carryover was described as less tight than in that earlier year.
Editorial reading: US ending-stocks looked as tight as the earlier window, but world carryover did not. The carryover-regime is therefore mixed rather than a clean replay.
The 2008 analog and the equity-demand-regime
After the 2008-09 tight-carryover window, soybeans approached a July 2008 high of $16.63 and later traded below $11 once the subsequent report was out.
A mid-2008 drop in a broad US equity index was cited as a demand regime that pushed grain prices below what the grain balance-sheet alone implied, and by 2012-13 that index was described as returning toward pre-2008 levels while consumers were more price-sensitive.
Editorial reading: an equity-demand-regime can move grain prices off the inventory script, so the balance-sheet is not read alone.
Scoring the midsummer-high
The case set a seasonal-high reference of the July 2008 peak plus or minus $0.50 and noted that soybeans had already exceeded that 2008 high by $1.30.
A monthly soybean series was used to mark repeated retreats from midsummer highs, and a similar 2013 fade was treated as the working path if later inventory prints stayed at their lows and a Southern Hemisphere crop was at least average.
Monthly soybean continuation through the 2012 drought peak
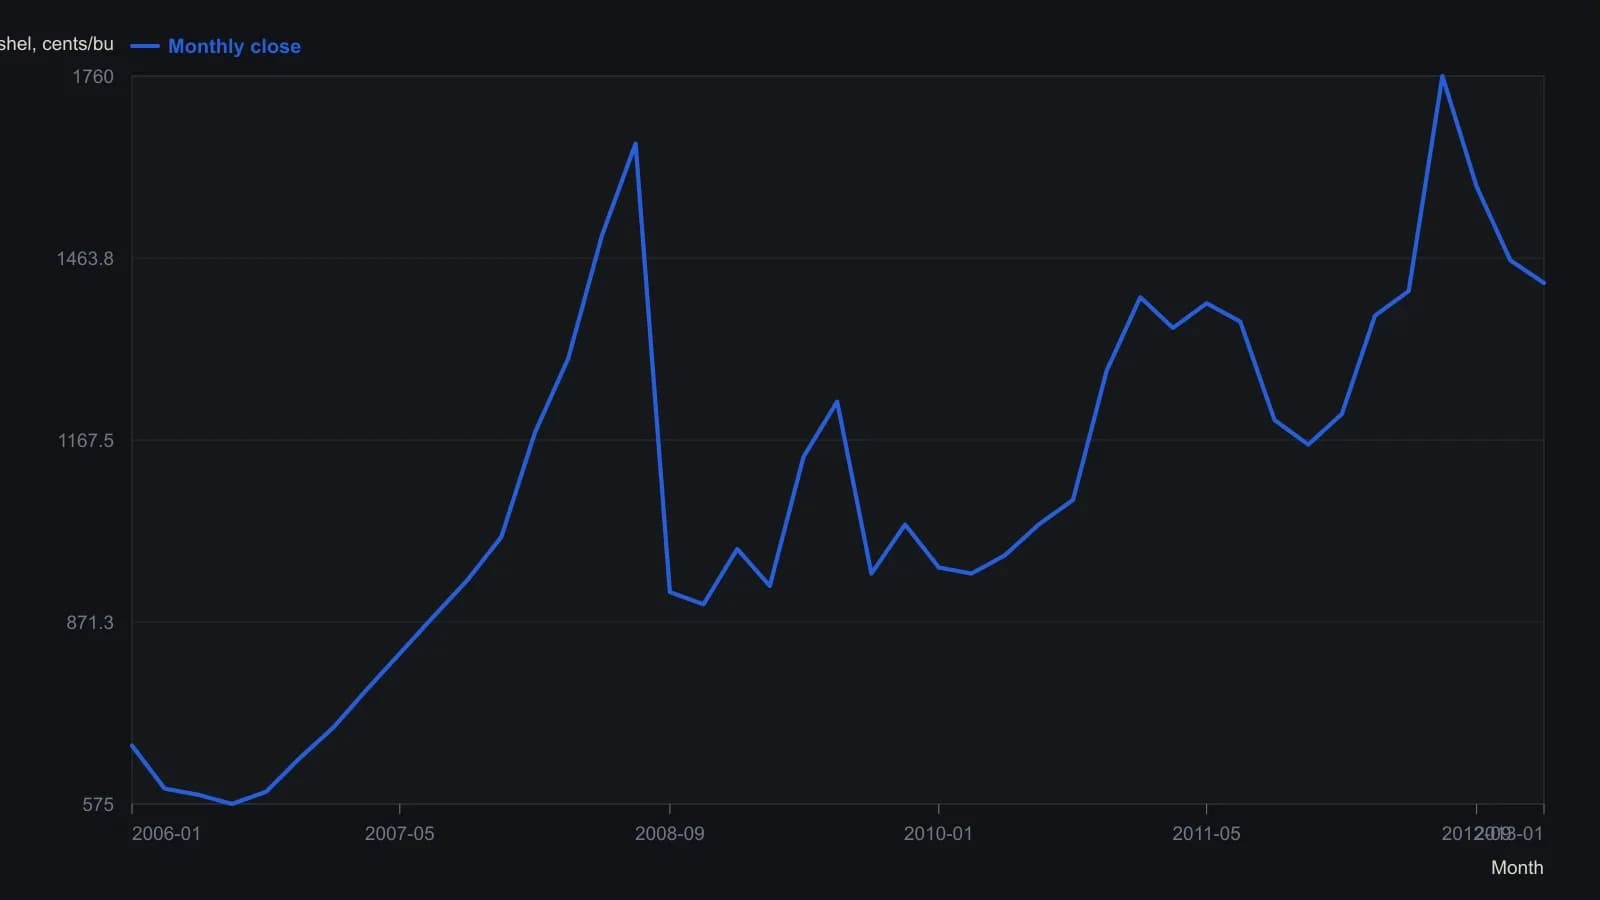
Closes are raster reads to the nearest 10–20 cents except the last quoted bar. The pane is monthly November/continuation soybeans, not a single cash series.
An option-floor beside old-crop prices
The write-up specified a hedge procedure that kept residual upside through options while placing a floor near then-current prices, using old-crop corn near $7.00 and old-crop soybeans near $14 as the reference levels.
Neither price-pattern nor inventory analysis alone was treated as sufficient.
All readings on this track · 41 readings
- 1989Evaluating venue volume as a speculation-breadth signal
- 1991A thirty-name price-weighted average as a seasonal regime classroom
- 1991Ranked half-year rate changes as an equity signal filter
- 1991Demographic wave as a market-regime overlay
- 1994Seasonal range regimes as a futures context overlay
- 1996Evaluating presidential party terms as equity regimes
- 1996A dominant cycle is a baseline, not a reprint
- 1996Seasonality and presidential election cycle regimes
- 1997Stacking calendar regimes around election years
- 1997Calendar seasonality as a testable trading procedure
- 1997Lunar phase delay as a testable seasonal regime
- 1998Seasonal system construction without curve-fitting
- 1999Crowd life cycle as a market regime map
- 2001Regime-dependent cycle timing after four-year and seasonal lows
- 2002A 2002 case study in regime-first seasonal selection
- 2002Seasonal windows and dominant-cycle rules
- 2002Fifty-four-year wholesale cycle as an inflation-deflation regime map
- 2004The championship conference rule as a yearly regime case study
- 2004Election-year seasonality as trade regime context
- 2006Two-ten inversion as an intermarket regime filter
- 2006Midterm-to-presidential seasonal holding window
- 2008Two-layer equity regimes from seasonality and price history
- 2008Seasonal futures as a regime filter, not a calendar rule
- 2008Retesting seasonal rules when regimes change
- 2010Corn and wheat staggered calendars as dollar-neutral seasonal spreads
- 2011Name the S&P 500 trend regime before using weekly and monthly seasonality
- 2012Seasonal windows that wait for confirmation
- 2013Pair-sleeve rotation as a two-state sector regime-switch
- 2013Lunar phase as a seasonal overlay on implied volatility
- 2013Soybean seasonal highs in a five-year carryover regime
- 2014Year-end tax-loss selling as a seasonal regime
- 2017Calendar-window overlays that mute mechanical signals without rewriting the system
- 2017A four-year cycle and volume case study of a secular bear
- 2017Treat the valuation climate as climate and implied-volatility extremes as weather
- 2019Seasonal depth versus tracking for futures position sizing
- 2019Stacking cycle forecasts with seasonal regimes
- 2019Hit-rate gates for seasonal regime evaluation
- 2019July to October as a seasonal window, not a reason to own the name
- 2020A recession-regime checklist from valuation stretch and the yield curve
- 2020Treat a seasonal idea as a stay-or-sit holding procedure
- 2020A single position as a sleeve on a seasonal regime map