1996issue C051-6
Evaluating presidential party terms as equity regimes
This evaluation asked whether the party occupying the White House corresponded to a subsequent difference in US equity-index behavior, then reversed the map to ask whether the four-year index path was associated with which party held office after the next election.
- Party-term-regime windows were labeled by the party occupying the White House, not by a specific president, and a same-party successor was treated as continuing that term's policy regime.
- Average annual change in the Dow Jones Industrial Average differed only modestly across party labels, while average opening-drawdown and average largest-retracement were larger in Republican-labeled terms.
- A policy-carryover-test of four consecutive Republican-labeled term pairs found the second term ahead twice and behind twice, which the evaluation treated as evidence against a reliable same-party carryover effect.
- A reverse-election-map associated a negative four-year index return with a later party change in four of five cases, and a positive first-term return with the same party remaining in office in seven of eight cases; those two rules together covered 65 percent of the elections in the sample.
The question the sample was built to answer
The motivating evaluation question was whether the party occupying the White House corresponded to a subsequent difference in US equity-index behavior. Each four-year window was handled as a party-term-regime: a market-context bucket labeled by the party occupying the US presidency, not as a forecast tied to one officeholder.
Editorial framing: treat the four-year political calendar as a regime-classification audit. First test whether a party label partitions return and drawdown in a balanced sample. Then flip the question and ask whether the index path is associated with the next party label more clearly than the party label is associated with the index.
How party-term-regime windows were assigned
Index results were segmented by four-year White House party terms from 1917 through 1995, with each window assigned to the party holding the office rather than to a specific president. When a president left office early, a same-party successor was treated as continuing that term's policy regime for classification purposes.
Four-year returns were measured from the February after a term began through the January in which the next term began. An unfinished mid-1990s term was counted as complete. The sample contained ten Republican-labeled terms and ten Democratic-labeled terms over 79 years.
Did the party label partition return and risk
Average annual change in the Dow Jones Industrial Average differed only modestly across party labels. Opening-drawdown was the decline from the prior term's closing level to the lowest low printed during the current four-year term. Largest-retracement was the decline from the highest high to the lowest low inside the same four-year term.
Average opening-drawdown and average largest-retracement were larger in Republican-labeled terms, and the extra return was described as less than proportionate to that extra risk.
A policy-carryover-test of consecutive same-party terms
A policy-carryover-test checks consecutive same-party terms to see whether the second term systematically inherits the first term's index outcome. Among four consecutive Republican-labeled term pairs, the second term's index result exceeded the first twice and lagged it twice, which the evaluation treated as evidence against a reliable same-party carryover effect.
A reverse-election-map from index path to party label
A reverse-election-map asks whether the index path during a term is associated with which party holds office after the next election. A negative four-year index return was followed by a party change after the next election in four of five sample cases. A positive four-year return in a first term coincided with the same party remaining in office in seven of eight cases. Those two rules together covered 65 percent of the elections in the sample.
Paths across administrations, not only end-point totals
Weekly-close path charts were assembled across successive administrations from 1917 through 1995 so term outcomes could be inspected as multi-year regimes rather than as single end-point totals. The closing judgment was that party affiliation alone did not appear to drive a large difference in index results, while the sample's worst four-year loss, worst opening-drawdown, and worst retracement occurred in Republican-labeled terms.
DJIA four-year total return by presidential term
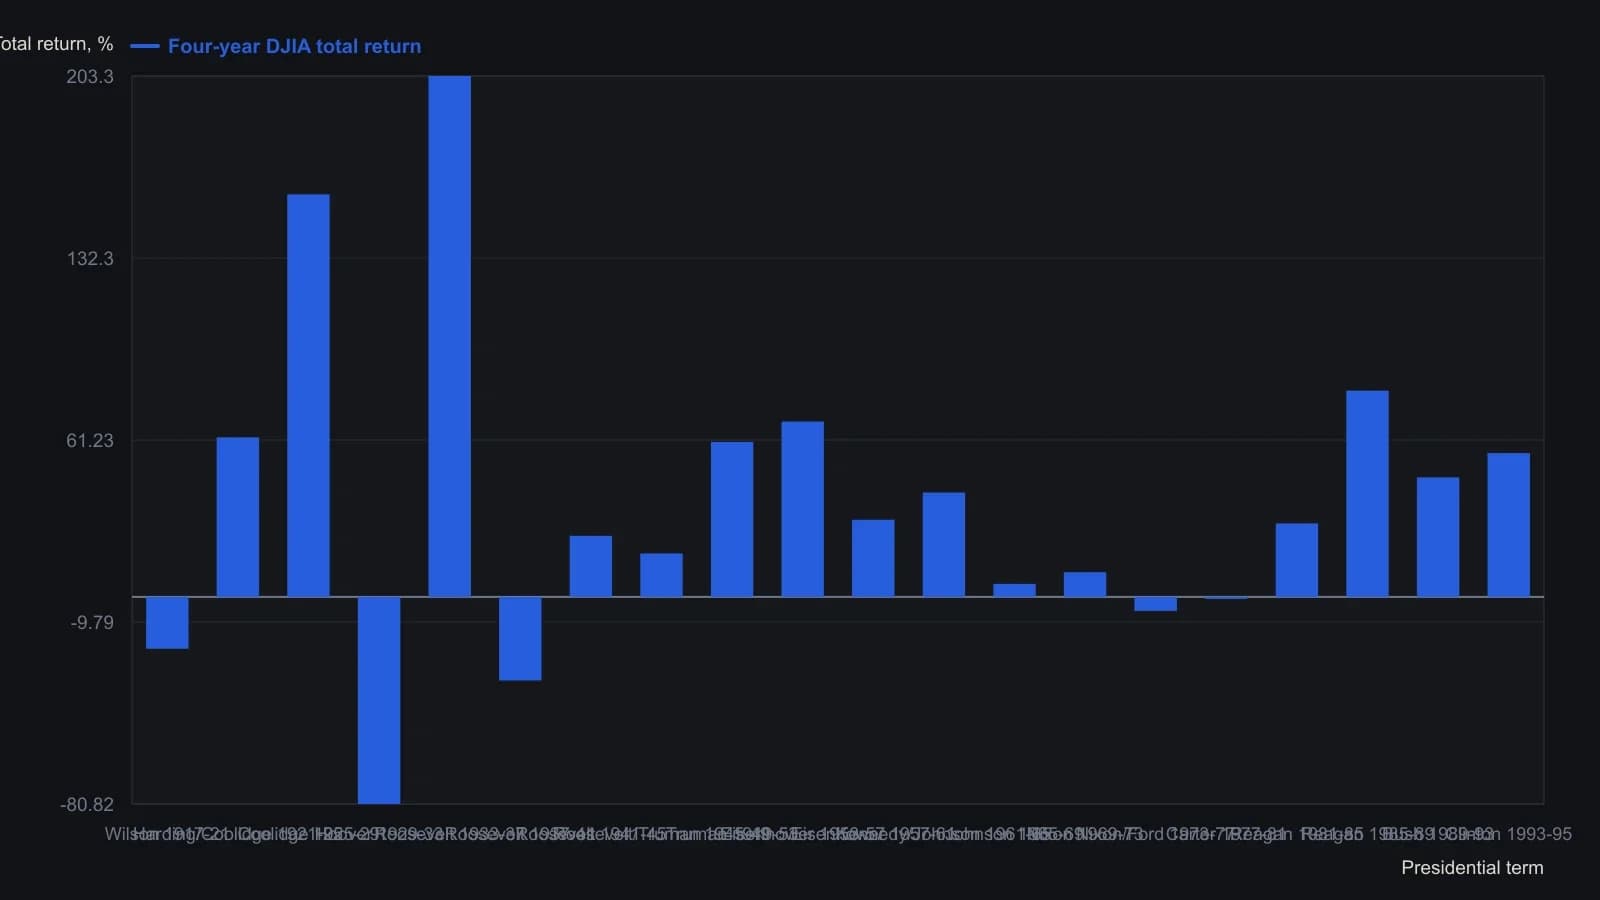
Clinton's window is February 1993 through December 1995 and was treated as a full term. Four intra-term successions kept the same party, so those rows are labeled with both names.
All readings on this track · 41 readings
- 1989Evaluating venue volume as a speculation-breadth signal
- 1991A thirty-name price-weighted average as a seasonal regime classroom
- 1991Ranked half-year rate changes as an equity signal filter
- 1991Demographic wave as a market-regime overlay
- 1994Seasonal range regimes as a futures context overlay
- 1996Evaluating presidential party terms as equity regimes
- 1996A dominant cycle is a baseline, not a reprint
- 1996Seasonality and presidential election cycle regimes
- 1997Stacking calendar regimes around election years
- 1997Calendar seasonality as a testable trading procedure
- 1997Lunar phase delay as a testable seasonal regime
- 1998Seasonal system construction without curve-fitting
- 1999Crowd life cycle as a market regime map
- 2001Regime-dependent cycle timing after four-year and seasonal lows
- 2002A 2002 case study in regime-first seasonal selection
- 2002Seasonal windows and dominant-cycle rules
- 2002Fifty-four-year wholesale cycle as an inflation-deflation regime map
- 2004The championship conference rule as a yearly regime case study
- 2004Election-year seasonality as trade regime context
- 2006Two-ten inversion as an intermarket regime filter
- 2006Midterm-to-presidential seasonal holding window
- 2008Two-layer equity regimes from seasonality and price history
- 2008Seasonal futures as a regime filter, not a calendar rule
- 2008Retesting seasonal rules when regimes change
- 2010Corn and wheat staggered calendars as dollar-neutral seasonal spreads
- 2011Name the S&P 500 trend regime before using weekly and monthly seasonality
- 2012Seasonal windows that wait for confirmation
- 2013Pair-sleeve rotation as a two-state sector regime-switch
- 2013Lunar phase as a seasonal overlay on implied volatility
- 2013Soybean seasonal highs in a five-year carryover regime
- 2014Year-end tax-loss selling as a seasonal regime
- 2017Calendar-window overlays that mute mechanical signals without rewriting the system
- 2017A four-year cycle and volume case study of a secular bear
- 2017Treat the valuation climate as climate and implied-volatility extremes as weather
- 2019Seasonal depth versus tracking for futures position sizing
- 2019Stacking cycle forecasts with seasonal regimes
- 2019Hit-rate gates for seasonal regime evaluation
- 2019July to October as a seasonal window, not a reason to own the name
- 2020A recession-regime checklist from valuation stretch and the yield curve
- 2020Treat a seasonal idea as a stay-or-sit holding procedure
- 2020A single position as a sleeve on a seasonal regime map