2013issue C1338-41
Lunar phase as a seasonal overlay on implied volatility
A case study placed a continuous lunation-cycle, built from lunar-azimuth readings, on a listed implied-volatility-index and inspected several multi-month regime-windows. The seasonal-overlay was kept as a pre-trade-attention-check, not as a standalone seasonal entry rule.
- After price-only checks on equities, currencies, and commodities had looked inconsistent, the case study compared a listed implied-volatility-index, using history from 1990, with new-moon and full-moon dates.
- The lunation-cycle was built from lunar-azimuth readings converted with a sine function, and weekend calendar days were kept so the phase path stayed continuous across non-trading days.
- In three regime-windows, implied-volatility highs clustered near full-moon dates and lows clustered near new-moon dates, sometimes with a short lead-lag.
- The write-up did not establish a causal link. The overlay was framed as a pre-trade-attention-check and not as a complete seasonal trading procedure.
A folkloric calendar on implied volatility
This case study used a lunation-cycle as a seasonal-overlay on a listed implied-volatility-index. That index is a listed estimate of expected market fluctuation, used here as the fear-and-greed series against which a lunar calendar is compared.
The comparison came after price-only checks on equities, currencies, and commodities had looked inconsistent. The implied-volatility-index, with history from 1990, was then lined up with new-moon and full-moon dates from the repeating new-moon to full-moon sequence.
Build a continuous phase series
The plotted lunar cycle was built from lunar-azimuth readings, which are horizon-angle readings, and converted with a sine function so the phase path could sit on the implied-volatility series.
Weekend calendar days were kept in the lunar series so the cycle would stay continuous across non-trading days.
Inspect several multi-month windows
A regime-window is a multi-month sample chosen so the same overlay can be viewed under more than one market backdrop.
In the 12 April 2004 to 30 July 2004 window, implied-volatility highs clustered near full-moon dates and lows clustered near new-moon dates, sometimes with a short lead-lag, meaning a short timing offset between a lunar date and an implied-volatility turning point.
The same full-moon high and new-moon low clustering was illustrated again for 13 April 2007 to 31 July 2007 and for 27 September 2012 to 14 January 2013.
VIX versus lunation cycle, April–August 2004
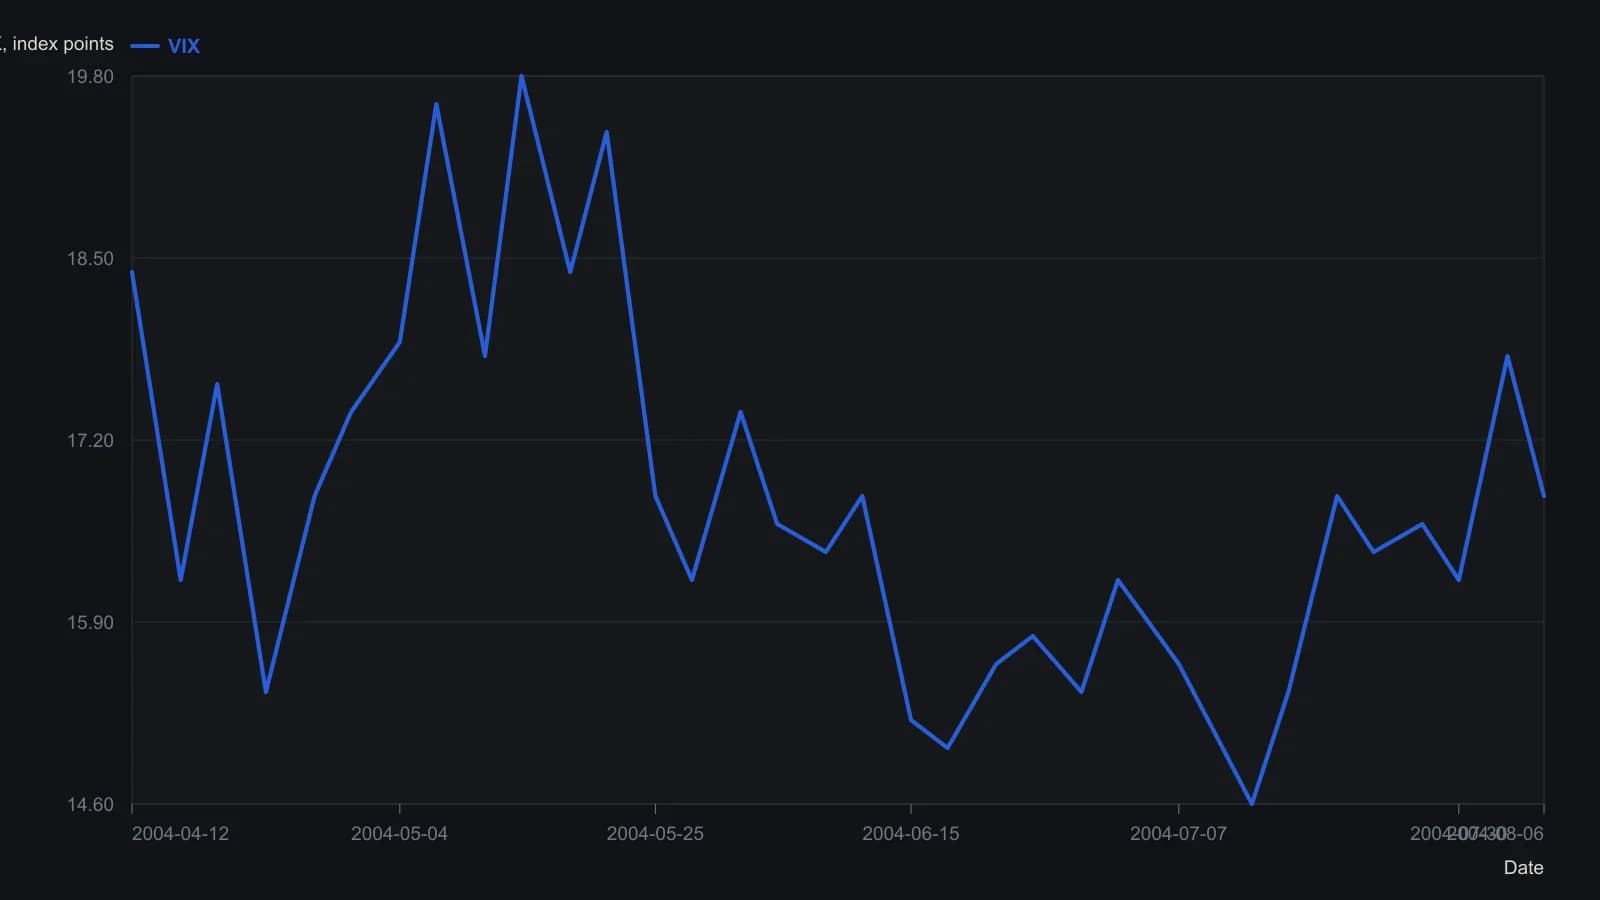
Y values are approximate readings from the candlestick raster; the source printed no numeric VIX series. Weekends were included in the author's lunation construction.
Keep the overlay as an attention check
The write-up did not establish a causal link between lunar phase and implied-volatility turns. Editorial note: coincidence inside chosen windows is not a demonstrated mechanism.
Lunar-declination was named as a substitute cycle input that could be used in a separate seasonality study.
The overlay was framed as a pre-trade-attention-check: a way to decide whether conditions deserve extra scrutiny before acting, rather than as an automatic signal.
All readings on this track · 41 readings
- 1989Evaluating venue volume as a speculation-breadth signal
- 1991A thirty-name price-weighted average as a seasonal regime classroom
- 1991Ranked half-year rate changes as an equity signal filter
- 1991Demographic wave as a market-regime overlay
- 1994Seasonal range regimes as a futures context overlay
- 1996Evaluating presidential party terms as equity regimes
- 1996A dominant cycle is a baseline, not a reprint
- 1996Seasonality and presidential election cycle regimes
- 1997Stacking calendar regimes around election years
- 1997Calendar seasonality as a testable trading procedure
- 1997Lunar phase delay as a testable seasonal regime
- 1998Seasonal system construction without curve-fitting
- 1999Crowd life cycle as a market regime map
- 2001Regime-dependent cycle timing after four-year and seasonal lows
- 2002A 2002 case study in regime-first seasonal selection
- 2002Seasonal windows and dominant-cycle rules
- 2002Fifty-four-year wholesale cycle as an inflation-deflation regime map
- 2004The championship conference rule as a yearly regime case study
- 2004Election-year seasonality as trade regime context
- 2006Two-ten inversion as an intermarket regime filter
- 2006Midterm-to-presidential seasonal holding window
- 2008Two-layer equity regimes from seasonality and price history
- 2008Seasonal futures as a regime filter, not a calendar rule
- 2008Retesting seasonal rules when regimes change
- 2010Corn and wheat staggered calendars as dollar-neutral seasonal spreads
- 2011Name the S&P 500 trend regime before using weekly and monthly seasonality
- 2012Seasonal windows that wait for confirmation
- 2013Pair-sleeve rotation as a two-state sector regime-switch
- 2013Lunar phase as a seasonal overlay on implied volatility
- 2013Soybean seasonal highs in a five-year carryover regime
- 2014Year-end tax-loss selling as a seasonal regime
- 2017Calendar-window overlays that mute mechanical signals without rewriting the system
- 2017A four-year cycle and volume case study of a secular bear
- 2017Treat the valuation climate as climate and implied-volatility extremes as weather
- 2019Seasonal depth versus tracking for futures position sizing
- 2019Stacking cycle forecasts with seasonal regimes
- 2019Hit-rate gates for seasonal regime evaluation
- 2019July to October as a seasonal window, not a reason to own the name
- 2020A recession-regime checklist from valuation stretch and the yield curve
- 2020Treat a seasonal idea as a stay-or-sit holding procedure
- 2020A single position as a sleeve on a seasonal regime map