1994issue C051-7
Unit-invariant trend filters and the c-test
A lookback trend filter can be rejected on methodological grounds, before any statistical trial, if a dimensional-coherency check shows that the forecast changes when only the units of measure change. The editorial standard is to rewrite the same forecast after an independent price rescale and a restated sampling interval, and to refuse historical comparison until those two versions still agree.
- Price and time are heterogeneous inputs: a valid trend filter must keep the same meaning when a price increment is restated in another unit over the same sampling interval.
- Angle-based trend rules fail that invariance, because the same ordered prices produce different inclination readings when only the vertical price scale is altered.
- The c-test multiplies every price term by a positive constant other than one and leaves nonprice terms unchanged; the filter passes only if its indications remain the same.
- Raw n-velocity is not a coherent standalone forecast, while a velocity-ratio and a percent-of-price-velocity leave the indication unchanged.
A pretest before historical comparison
A lookback trend filter turns an ordered price series into a forecast of relative trend strength or direction over a defined sampling interval. It can be rejected on methodological grounds, before any statistical trial, if a dimensional-coherency check applied to its formulas shows that the forecast changes when only the units of measure change.
Dimensional-coherency is the requirement that the forecast not depend on an arbitrary choice of price unit or an independently restated time unit. Price-time-heterogeneity is the reason that check is not automatic: price units and time units need not be rescaled together, so a valid rule must survive changing either axis on its own.
Price and time are not interchangeable
Price and time are heterogeneous inputs. A valid rule must keep the same meaning when a price increment is restated in another unit over the same sampling interval.
Angle rules fail the invariance check
Angle-based trend rules fail that invariance. The same ordered prices produce different right-angle or inclination readings when only the vertical price scale is altered.
A rule that the second leg of a rise must incline at twice the first-leg angle is incoherent, because a price-axis rescale can push the first leg far enough that the required second-leg angle would reverse time.
Connecting observed prices on given dates is an incidence construction, not an angle filter. The crossing price and date can stay fixed while chart angles change with the price axis.
Mixed efficiency scores can reverse order
Mixing price increments with elapsed-time terms in one lookback efficiency score can invert the ranking of two three-observation series after every price is multiplied by the same positive constant used in the c-test. Readings that looked nearly tied can switch order once only the price unit changes.
December 1989 gold, July–December 1989
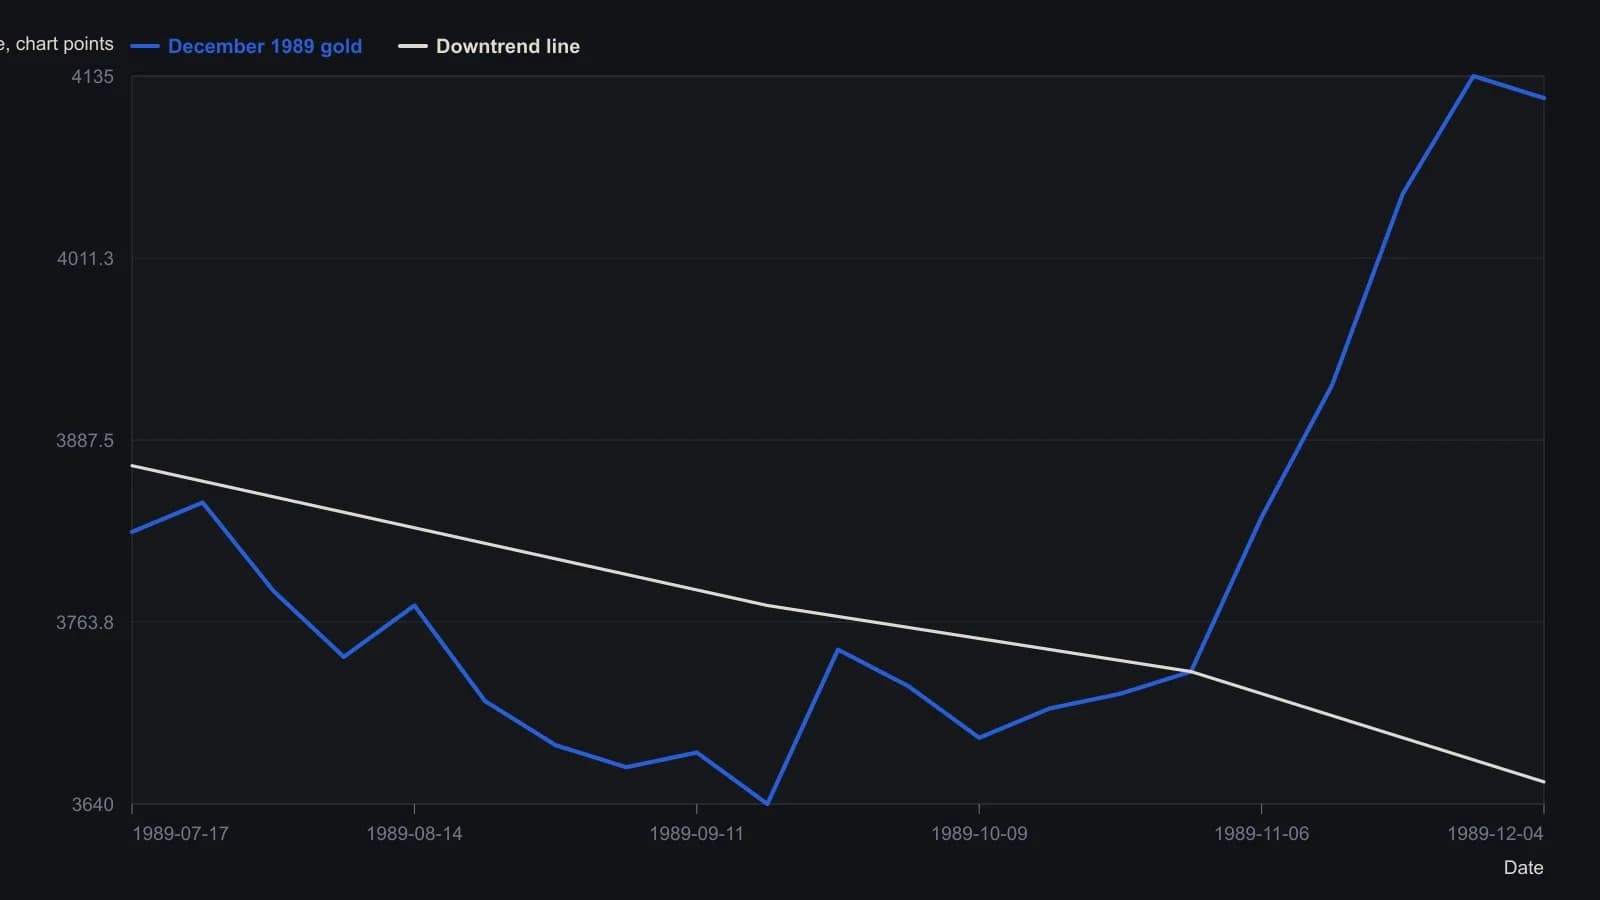
Figures 1–3 are the same contract and dates; only the price axis changes. Values are weekly samples of the plotted bars, not a printed table, so they are approximate.
How the c-test is applied
The c-test is a formula-level screen. The coherency procedure multiplies every price term by a positive constant other than one and leaves nonprice terms unchanged. The filter passes only if its indications remain the same.
n-velocity is net price change over a lookback of n observations, divided by n minus one. Under the c-test that raw level is itself rescaled with price, so it is not a coherent standalone forecast.
The ratio of two such velocities is invariant. Dividing the velocity by current price also leaves the indication unchanged. Those two rewrites are the velocity-ratio and the percent-of-price-velocity.
What still fails after a pass
A velocity-ratio is a dimensionally consistent comparison of relative trend strength, but it becomes erratic when the denominator is near zero. A percent-of-price-velocity passes the unit check yet still has different typical ranges across futures contracts.
All readings on this track · 33 readings
- 1988Opening-range brackets, a two-bar trend filter, and bounded stops
- 1990Bezier-curve price trend filter
- 1992Constructing a damping-index trend filter
- 1992Building a random walk index trend filter
- 1992Phase diagrams for moving-average trend filters
- 1993Volume-weighted change smoothing and trend ranking
- 1993Concurrent highest-low filter with a largest-low-fall trigger
- 1994Unit-invariant trend filters and the c-test
- 1995Constructing cup and cap entries with a three-bar net line
- 1997Why a daily timing evaluation depends on interval, lookbacks, and the fitting objective
- 2001A volume budget clock for trend-segment construction
- 2001Keep three jobs separate when you test a composite score
- 2002Evaluating the weekly four-percent close filter as a market-state procedure
- 2003Constructing a confirmed zigzag trend filter
- 2004Decompose high, low, and close into separate forecast streams
- 2005Three-state moving-average breakout bar coloring
- 2005Constructing a volume and move-adjusted trend filter
- 2005A fifty-day average breakout as a trend permission filter
- 2005Current-bar inclusion can mute a stochastic channel break
- 2006A stochastic oscillator gated by a long-term exponential average
- 2010A construction test for a modified volume-price trend filter
- 2011Constructing a Spearman rank trend filter
- 2013Constructing a repeated-median slope as a resistant trend filter
- 2014Combining a relative-strength index and trend filters for oversold setups
- 2014Price-rooted lookbacks for a relative strength index, a moving average, and a trend filter
- 2015Evaluating next-session intermarket range forecasts
- 2018Read the intermarket weight matrix first, then the predicted moving-average filter
- 2018Constructing the stiffness trend filter from moving-average holds
- 2018The averaging kernel and the lagged trend gate are separate specifications
- 2019A trend filter is not ready to compare until portfolio constraints are written down
- 2019Lookback, threshold, and position-capacity for a stiffness trend-filter
- 2020Combining a trend filter with a moving average and a stochastic oscillator
- 2020Constructing a relative-strength oscillator with a rank-agreement trend filter