1987issue C111-6
Testing price-volume agreement after percent reversal filters
A price-percent-filter records a new date only when the move from the latest peak or trough meets a chosen threshold and runs opposite the previous filtered change. Those kept dates form a trend-reversal-sample, and each signed-price-volume-pair is then summarized with a price-volume-cross-correlation and a chi-square-from-correlation.
- A price-percent-filter records a new date only when the percent change from the latest peak or trough meets a chosen threshold and runs opposite the previous filtered change.
- Each kept event stores the date, the industrial-average close, and exchange total volume so later signed changes can be computed from those tabulated points.
- After each tabulation, the sign of the price change is paired with the sign of the change in cumulative volume and assigned to one of four cells.
- In the window from 13 June 1949 through 2 January 1987, the 10 percent filter had the largest positive signed-change coefficient, and nine of the ten filter sizes had a chi-square confidence above 99.5 percent.
What the design is asking
The archive workflow builds observations first, then tests association on those observations alone. Editorial reading: TradersWeek treats the price-percent-filter as the sampling design, not a chart overlay. The filter chooses which swings become the trend-reversal-sample. A four-cell test then asks whether volume changed in the same direction as those filtered price swings.
How turning points are selected
A price-percent-filter records a new date only when the percent change from the latest peak or trough meets a chosen threshold and runs opposite the previous filtered change. The sequence of those filter dates is the trend-reversal-sample.
Each kept event stores the date, the industrial-average close, and exchange total volume so later signed changes can be computed from those tabulated points.
Signed pairs and the four-cell test
After each tabulation, the sign of the price change is paired with the sign of the change in cumulative volume. That signed-price-volume-pair is assigned to one of four cells.
Association is summarized with a price-volume-cross-correlation, the four-cell coefficient that records whether filtered price changes and volume changes tend to share the same sign. The chi-square-from-correlation equals that coefficient squared times the number of pairs.
The same test across filter sizes
The same statistics were produced for every integer filter size from 1 percent through 10 percent across four windows spanning the start of 1897 through the start of 1987.
In the window from 13 June 1949 through 2 January 1987, the 10 percent filter had the largest positive signed-change coefficient among the ten sizes, followed by the 9 percent filter. In that same later window, nine of the ten filter sizes had a chi-square confidence above 99.5 percent. The 8 percent size was the exception and still exceeded 99 percent.
DJIA–NYSE volume cross-correlation versus filter size
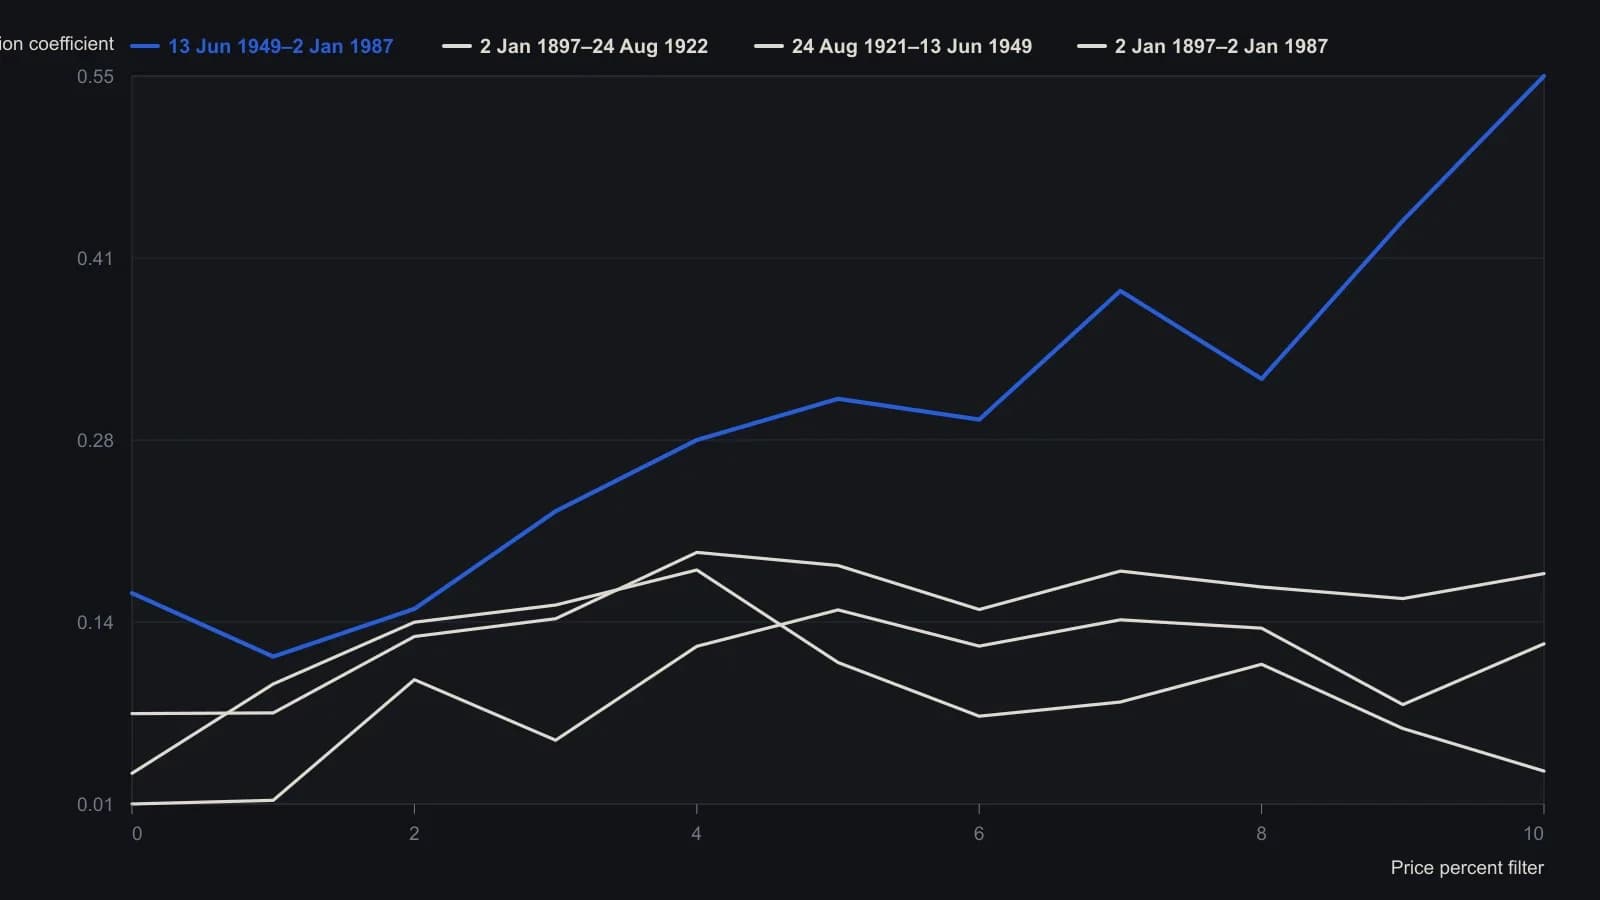
The 0 percent row is the unfiltered daily sample. Larger filters keep far fewer turning points, so chi-square (r²N) is not comparable across rows even when r rises.
Chart overlays of the kept dates
Charted overlays used a 10 percent filter on price and volume from the start of 1897 through 12 August 1982, then compared 1 percent and 10 percent filters from 12 August 1982 through 12 December 1986.
Editorial note: TradersWeek reads those overlays as pictures of the same trend-reversal-sample used in the four-cell counts, not as a separate trading rule.
All readings on this track · 17 readings
- 1987Testing price-volume agreement after percent reversal filters
- 1988Constructing chi-square tests for two-way price counts
- 1988Building consensus indicators with correlation and the chi-square test
- 1988Test edges against chance, not story
- 1988Constructing an advance-decline divergence oscillator
- 1989Evaluate a contrary put-call premium ratio at a stated horizon
- 1990A weekly resistance-index from hourly volume-per-point
- 1990Testing breadth above moving averages by horizon
- 1990Evaluating member versus odd-lot breadth
- 1990A chi-square test of split frequency histograms across price aggregations
- 1990Evaluating smoothed secondary counts with a chi-square test
- 1991Treat session high and low times as codes, then require a chi-square check
- 1991A signed hourly swing catalog as a next-session chi-square check
- 1992Constructing a chi-square test as a gate for two-way market records
- 1992Percent filters, log point-and-figure, and breadth residuals
- 1997Build a chi-square stationarity screen before you forecast
- 1998Timed breakout rules after a nested-bar contraction