1992issue C091
Building a random walk index trend filter
This archive note reconstructs a trend filter from ordered daily highs, lows, and closes. The random walk index divides the distance from a prior opposite extreme to today's extreme by the lookback-window average of true range times the square root of that lookback length.
- The filter is assembled from ordered daily highs, lows, and closes, with the newest bar last and the current high and low treated as if the session is still open.
- The random walk index denominator is the lookback-window average of true range multiplied by the square root of that lookback length.
- The reported low-side index is the largest of the one-through-nine lookback ratios, and a reading greater than 1 is treated as a trending low rather than a random range.
- The high-side index keeps the same denominator and replaces the numerator with today's high minus the low from n days earlier.
How the series is assembled
The trend filter is assembled from ordered daily highs, lows, and closes, with the newest bar last and the current high and low treated as if the session is still open.
The random walk index is the ratio of the distance from a prior opposite extreme to today's extreme, divided by average true range times the square root of the lookback length.
True range and the denominator
True range is the greater of the current high minus the current low and the prior close minus today's low. It is the larger of the current high-to-low span and the gap from the prior close to today's low, so an overnight gap is not recorded as a narrow day.
The index denominator is the lookback-window average of true range multiplied by the square root of that lookback length. Lookback is the number of sampling intervals used both to average true range and to set the square-root time scaling.
Building the low-side index
The low-side index places a prior high minus today's low in the numerator to test whether the current low has left a random range.
On the low side, a two-interval reading uses yesterday's high minus today's low, divided by the two-day average true range times the square root of 2. On the low side, a three-interval reading uses the high from two days earlier minus today's low, divided by the three-day average true range times the square root of 3.
The low-side ratio is repeated for lookbacks of 1 through 9 intervals, and the reported index is the largest of those ratios. A reading greater than 1 on any lookback is treated as a trending low rather than a random range. In the worked example the largest reading is 1.25.
The high-side index and longer lookbacks
The high-side index keeps the same denominator and replaces the numerator with today's high minus the low from n days earlier.
Lookback lengths longer than 8 days are the setting given for longer-horizon trend readings. The trend filter labels a price extreme as trending when its displacement exceeds a true-range baseline scaled by the square root of the lookback.
Low-side random walk index by lookback
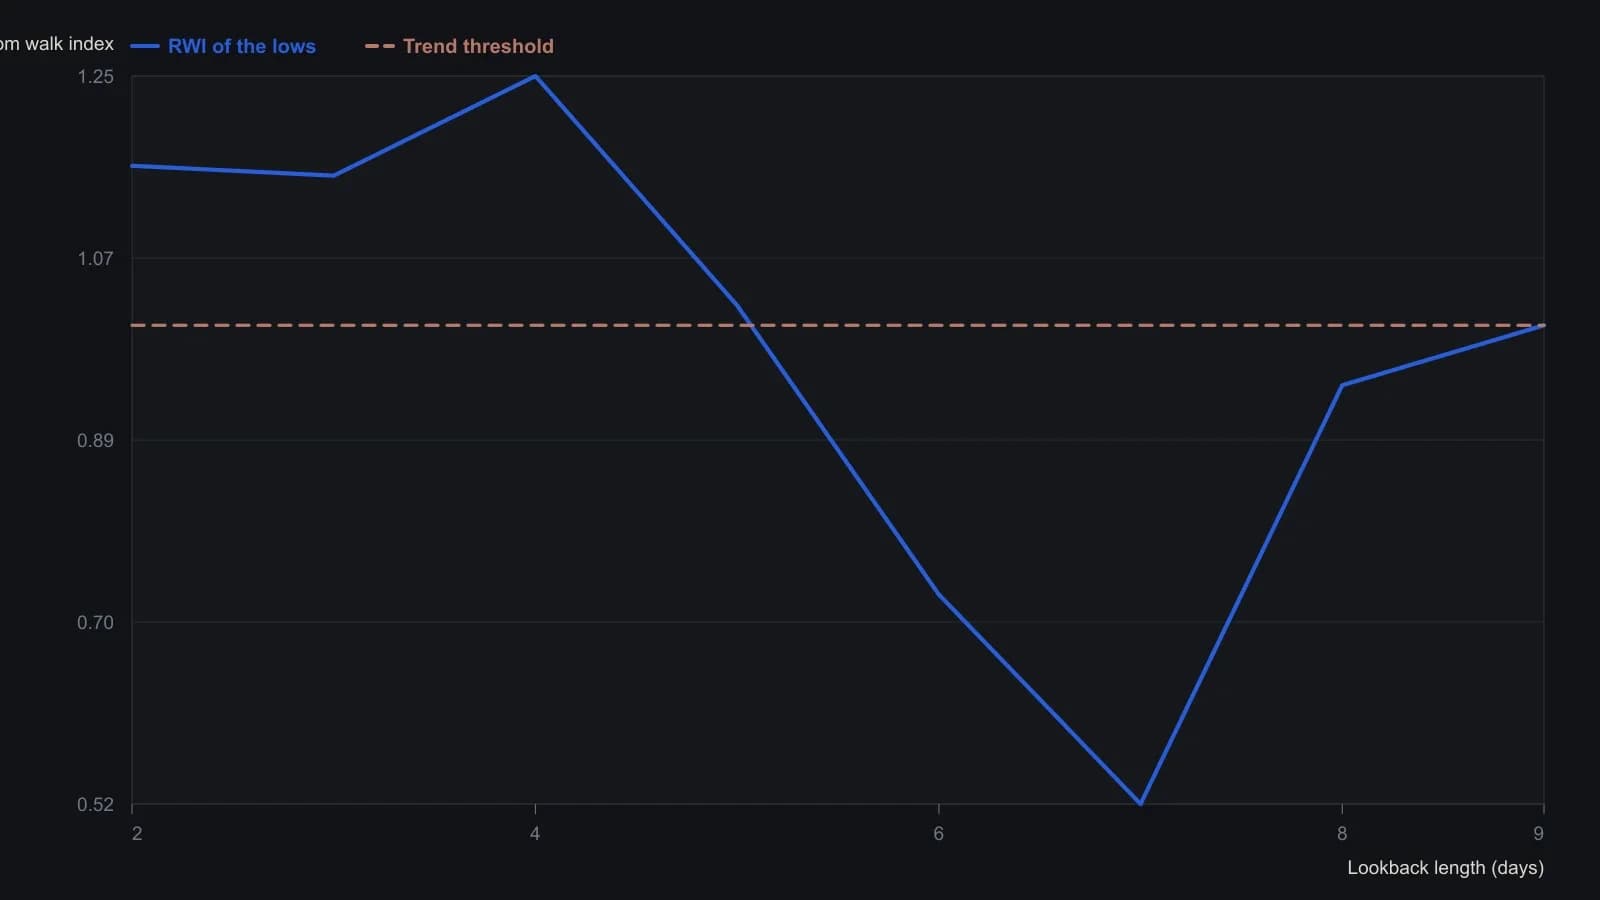
Only the low-side index is shown, and the last bar has no close because the session is still open. The sidebar stops at nine days; Poulos treats windows longer than eight days as the longer-horizon test.
All readings on this track · 33 readings
- 1988Opening-range brackets, a two-bar trend filter, and bounded stops
- 1990Bezier-curve price trend filter
- 1992Constructing a damping-index trend filter
- 1992Building a random walk index trend filter
- 1992Phase diagrams for moving-average trend filters
- 1993Volume-weighted change smoothing and trend ranking
- 1993Concurrent highest-low filter with a largest-low-fall trigger
- 1994Unit-invariant trend filters and the c-test
- 1995Constructing cup and cap entries with a three-bar net line
- 1997Why a daily timing evaluation depends on interval, lookbacks, and the fitting objective
- 2001A volume budget clock for trend-segment construction
- 2001Keep three jobs separate when you test a composite score
- 2002Evaluating the weekly four-percent close filter as a market-state procedure
- 2003Constructing a confirmed zigzag trend filter
- 2004Decompose high, low, and close into separate forecast streams
- 2005Three-state moving-average breakout bar coloring
- 2005Constructing a volume and move-adjusted trend filter
- 2005A fifty-day average breakout as a trend permission filter
- 2005Current-bar inclusion can mute a stochastic channel break
- 2006A stochastic oscillator gated by a long-term exponential average
- 2010A construction test for a modified volume-price trend filter
- 2011Constructing a Spearman rank trend filter
- 2013Constructing a repeated-median slope as a resistant trend filter
- 2014Combining a relative-strength index and trend filters for oversold setups
- 2014Price-rooted lookbacks for a relative strength index, a moving average, and a trend filter
- 2015Evaluating next-session intermarket range forecasts
- 2018Read the intermarket weight matrix first, then the predicted moving-average filter
- 2018Constructing the stiffness trend filter from moving-average holds
- 2018The averaging kernel and the lagged trend gate are separate specifications
- 2019A trend filter is not ready to compare until portfolio constraints are written down
- 2019Lookback, threshold, and position-capacity for a stiffness trend-filter
- 2020Combining a trend filter with a moving average and a stochastic oscillator
- 2020Constructing a relative-strength oscillator with a rank-agreement trend filter