1993issue C041-10
Volume-weighted change smoothing and trend ranking
A historical construction multiplies session net price change by recorded volume, drops quiet sessions with an explicit participation-threshold, and converts nested moving-average slopes into a 1-to-9 directional-rank.
- Market-volume-impact is the product of a session net price change and the volume recorded with that change, not a change scored against calendar time.
- A participation-threshold omits sessions with volume below 170 million shares so low-activity prints do not enter the series.
- A moving-average stack produces a short-horizon-line and a long-horizon-line, then a directional-rank from 1 to 9 encodes whether those lines are rising, flat, or falling, with more weight on the longer line.
- Two sessions with nearly identical price changes can still receive unequal products when their volumes differ.
The raw product
Volume-price-analysis treats signed price change multiplied by associated volume as the market message, rather than change measured against calendar time. The raw series is formed by multiplying a session net price change by the volume recorded with that change. That product is the market-volume-impact.
One documented pairing multiplies the daily net change of a large-cap industrial average by total New York Stock Exchange volume.
Calendar time is used only to isolate study windows. The construction treats the price-volume product, not elapsed time, as the quantity that defines impact.
A participation cutoff
A participation-threshold is a volume floor below which a session is omitted so low-activity prints do not enter the series. Sessions with volume below 170 million shares are omitted from the product so low-participation days do not enter the series.
Nested moving averages
A moving-average is a fixed-lookback smoother applied first to the raw product and then again to produce nested short-horizon and long-horizon lines. The raw product is first smoothed with a 10-period simple moving average. That result is then smoothed with a five-period average, and that short-horizon-line is smoothed again with a 10-period average.
The short-horizon-line is a five-period average of the first ten-period smooth of the raw product. The long-horizon-line is a ten-period average of the short-horizon-line. Both smoothed lines are plotted.
Smoothed market-volume impact, January 1992
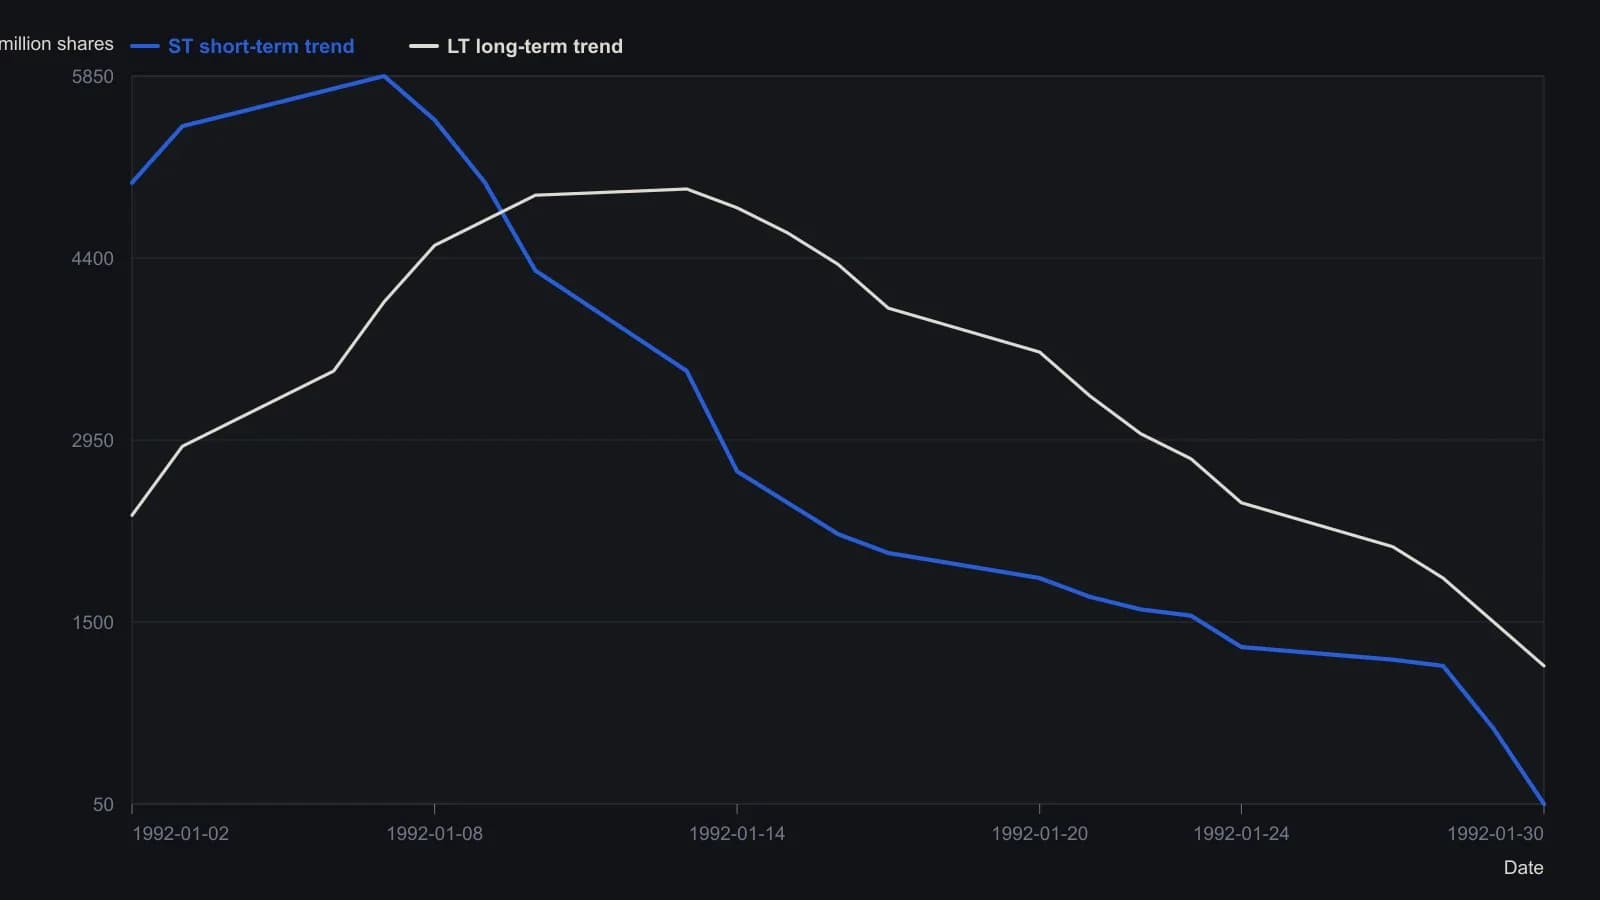
Read from the plotted ST and LT markers and rounded to the nearest 50 units. The source drops sessions with NYSE volume under 170 million shares, forms a 10-period average S, then ST as the 5-day average of S and LT as the 10-day average of ST. The 1–9 rank marks on the figure are labels, not a third series. Weekday dates follow the January 1992 calendar implied by the printed ticks.
A 1-to-9 directional rank
A trend-filter uses the paired short-horizon and long-horizon slopes, plus a numeric rank of those slopes, to accept or reject a directional reading. The plotted lines are converted into a directional-rank, an integer from 1 to 9 that encodes whether the two smoothed lines are rising, flat, or falling, with more weight on the longer line. Rank 1 is the most constructive reading and rank 9 is the most adverse.
The rank is 1 when both lines are rising, 2 when the long-horizon-line is rising and the short-horizon-line is flat, and 3 when the long-horizon-line is rising and the short-horizon-line is falling. The rank is 9 when both lines are falling. The long-horizon slope is given more influence than the short-horizon slope.
When similar prices are not interchangeable
Two sessions with nearly identical downward price changes can receive unequal products when one prints more than 200 million shares and the other prints less than 180 million shares. Two sessions with nearly equal price changes in opposite directions still receive unequal products when one prints 220 million shares and the other prints 194 million shares.
All readings on this track · 33 readings
- 1988Opening-range brackets, a two-bar trend filter, and bounded stops
- 1990Bezier-curve price trend filter
- 1992Constructing a damping-index trend filter
- 1992Building a random walk index trend filter
- 1992Phase diagrams for moving-average trend filters
- 1993Volume-weighted change smoothing and trend ranking
- 1993Concurrent highest-low filter with a largest-low-fall trigger
- 1994Unit-invariant trend filters and the c-test
- 1995Constructing cup and cap entries with a three-bar net line
- 1997Why a daily timing evaluation depends on interval, lookbacks, and the fitting objective
- 2001A volume budget clock for trend-segment construction
- 2001Keep three jobs separate when you test a composite score
- 2002Evaluating the weekly four-percent close filter as a market-state procedure
- 2003Constructing a confirmed zigzag trend filter
- 2004Decompose high, low, and close into separate forecast streams
- 2005Three-state moving-average breakout bar coloring
- 2005Constructing a volume and move-adjusted trend filter
- 2005A fifty-day average breakout as a trend permission filter
- 2005Current-bar inclusion can mute a stochastic channel break
- 2006A stochastic oscillator gated by a long-term exponential average
- 2010A construction test for a modified volume-price trend filter
- 2011Constructing a Spearman rank trend filter
- 2013Constructing a repeated-median slope as a resistant trend filter
- 2014Combining a relative-strength index and trend filters for oversold setups
- 2014Price-rooted lookbacks for a relative strength index, a moving average, and a trend filter
- 2015Evaluating next-session intermarket range forecasts
- 2018Read the intermarket weight matrix first, then the predicted moving-average filter
- 2018Constructing the stiffness trend filter from moving-average holds
- 2018The averaging kernel and the lagged trend gate are separate specifications
- 2019A trend filter is not ready to compare until portfolio constraints are written down
- 2019Lookback, threshold, and position-capacity for a stiffness trend-filter
- 2020Combining a trend filter with a moving average and a stochastic oscillator
- 2020Constructing a relative-strength oscillator with a rank-agreement trend filter