2014issue C0126-31
Combining a relative-strength index and trend filters for oversold setups
How a 14-period relative-strength index, a price-only volatility proxy, and a 200-day simple moving average are stacked so oversold VixRSI readings can be read with a trend filter rather than as standalone triggers.
- A 14-period relative-strength index is a 0-to-100 oscillator from average gains and losses, updated after the first window with a 13-plus-current smoothing step.
- VixRSI divides a three-day exponential average of a 22-day price-only volatility proxy by a three-day exponential average of that relative-strength index, and higher composite readings tend to mark oversold conditions.
- Example oversold setups use composite levels such as 1.40, and those spikes are described as more useful when the close is above a 200-day simple moving average.
- A companion RSIjk oscillator and less stringent cutoffs identify more candidate setups, while shorter lookbacks make the composites more likely to spike.
What is being stacked
A relative-strength index is a bounded oscillator built from average gains and losses over a defined lookback, commonly used to mark overbought and oversold conditions. This article walks through how that oscillator is paired with a price-only volatility proxy and with moving averages that both damp indicator noise and define a long-horizon trend regime.
The trend filter is the directional screen in the stack. It is the step that asks whether an oversold or overbought reading occurs with the prevailing trend, typically defined by price relative to a long moving average.
How the 14-period relative-strength index is built
A 14-period relative-strength index is formed from the ratio of average gains to average losses, producing a bounded daily reading that can range from 0 to 100. After the first 14-period window, subsequent relative-strength averages are updated with a 13-plus-current smoothing step rather than a simple restart of the lookback.
A price-only volatility proxy
A price-only volatility proxy, the vix-fix, is a stand-in for implied-volatility spikes. It is computed from the highest close over the latest 22 trading days minus the current low, scaled by that high close, then multiplied by 100 and shifted by 50.
How VixRSI is formed
The composite VixRSI reading is the three-day exponential moving average of that volatility proxy divided by the three-day exponential moving average of the 14-period relative-strength index. Those short exponential averages are the moving-average step that damps noise in each component before the ratio is taken.
As formulated, the composite is inverted: oversold conditions tend to coincide with higher readings and overbought conditions with lower readings.
Example oversold setups and the 200-day screen
Example oversold setups include a composite reading of 1.40 or higher, a one-day decline after first exceeding at least 1.40, or a decline after at least three consecutive rising days once the reading has exceeded at least 1.00.
Oversold spikes in the composite are described as more useful when the security is in an identifiable uptrend, for example when the close is above its 200-day simple moving average. That long simple moving average is the trend-regime half of the moving-average role in this stack.
Goldman Sachs daily VixRSI against the 1.40 oversold line
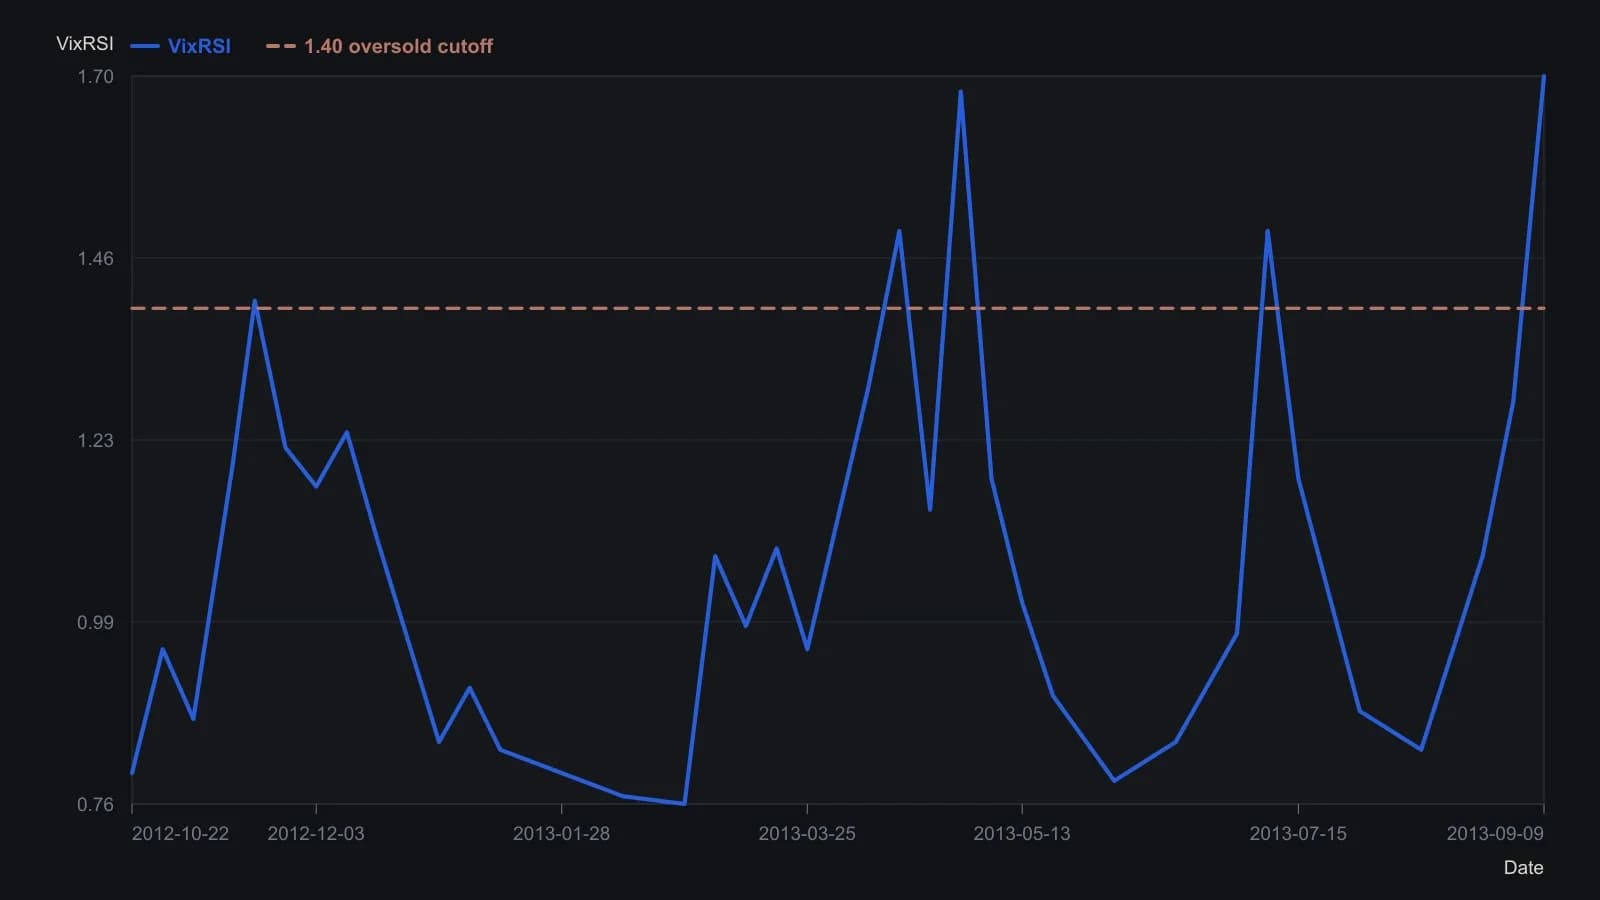
VixRSI is a 3-day EMA of Williams’s 22-day price-only VIX fix divided by a 3-day EMA of 14-day RSI, so high readings are the oversold side. Values are approximate readings off the published raster, not a tick dump.
A companion RSIjk oscillator
A companion oscillator, RSIjk, recenters the 14-period relative-strength index around zero, adds a three-day change term, smooths that sum with a two-day exponential average, then adds the centered reading back. The result is a signed scale that can range from 100 to -100.
Less stringent cutoffs and lookback length
Using the same two composites with less stringent cutoffs, such as a VixRSI above 1.00, an RSIjk below -16, and a close above the 200-day simple moving average, identifies more candidate setups. Some of those setups may arrive earlier or fail to develop as cleanly as setups from tighter cutoffs.
Shortening the 22-day volatility window or the 14-day relative-strength window makes the composites more volatile and more likely to spike. Lengthening those windows tends to isolate only more extreme oversold readings.
All readings on this track · 33 readings
- 1988Opening-range brackets, a two-bar trend filter, and bounded stops
- 1990Bezier-curve price trend filter
- 1992Constructing a damping-index trend filter
- 1992Building a random walk index trend filter
- 1992Phase diagrams for moving-average trend filters
- 1993Volume-weighted change smoothing and trend ranking
- 1993Concurrent highest-low filter with a largest-low-fall trigger
- 1994Unit-invariant trend filters and the c-test
- 1995Constructing cup and cap entries with a three-bar net line
- 1997Why a daily timing evaluation depends on interval, lookbacks, and the fitting objective
- 2001A volume budget clock for trend-segment construction
- 2001Keep three jobs separate when you test a composite score
- 2002Evaluating the weekly four-percent close filter as a market-state procedure
- 2003Constructing a confirmed zigzag trend filter
- 2004Decompose high, low, and close into separate forecast streams
- 2005Three-state moving-average breakout bar coloring
- 2005Constructing a volume and move-adjusted trend filter
- 2005A fifty-day average breakout as a trend permission filter
- 2005Current-bar inclusion can mute a stochastic channel break
- 2006A stochastic oscillator gated by a long-term exponential average
- 2010A construction test for a modified volume-price trend filter
- 2011Constructing a Spearman rank trend filter
- 2013Constructing a repeated-median slope as a resistant trend filter
- 2014Combining a relative-strength index and trend filters for oversold setups
- 2014Price-rooted lookbacks for a relative strength index, a moving average, and a trend filter
- 2015Evaluating next-session intermarket range forecasts
- 2018Read the intermarket weight matrix first, then the predicted moving-average filter
- 2018Constructing the stiffness trend filter from moving-average holds
- 2018The averaging kernel and the lagged trend gate are separate specifications
- 2019A trend filter is not ready to compare until portfolio constraints are written down
- 2019Lookback, threshold, and position-capacity for a stiffness trend-filter
- 2020Combining a trend filter with a moving average and a stochastic oscillator
- 2020Constructing a relative-strength oscillator with a rank-agreement trend filter