2005issue C031-2
A fifty-day average breakout as a trend permission filter
In January 2005 the S&P 500 hovered around its 50-day average of closing prices, then left that band and later retested the 1190 breakout area on a five-minute e-mini chart. The average was used as a trend filter that permitted only longs above it and only shorts below it.
- A 50-day average of closing prices served as a trend filter that permitted only long entries while the S&P 500 was above it and only short entries while it was below it.
- Closes on January 11 and January 12, 2005 stayed too near the line, so those sessions were not treated as a settled break.
- After the January 18 break back above the average near 1190, a five-minute e-mini pullback to that area around 8:05 a.m. continued higher.
- Editorial: Let the daily average state the only allowed direction, then treat a later close-side break as a hypothesis tested only after a lower-timeframe retest of the breakout level.
A permission line, then a later break
This archive case follows the S&P 500 in January 2005 around a 50-day moving average. Here that moving average is a 50-day average of closing prices, a slowly updating reference line against which daily closes can be judged above or below.
The same line was used as a trend filter: a binary permission rule that allows only long setups while the index is above the 50-day average and only short setups while it is below.
A hover that was not a settled break
From January 5, 2005, the S&P 500 spent several sessions only slightly above its 50-day moving average before any later close resolved that hover.
On January 11, 2005, the index traded through the 50-day moving average during the session and closed just below it, still too close to treat the break as settled.
On January 12, 2005, the index fell well below the 50-day moving average, then closed back above it by only a small margin.
Editorial: While the daily close keeps hugging the reference line, the trend filter has not yet granted a new side. The hover is information about indecision, not a completed breakout.
S&P 500 daily closes versus the 50-day average
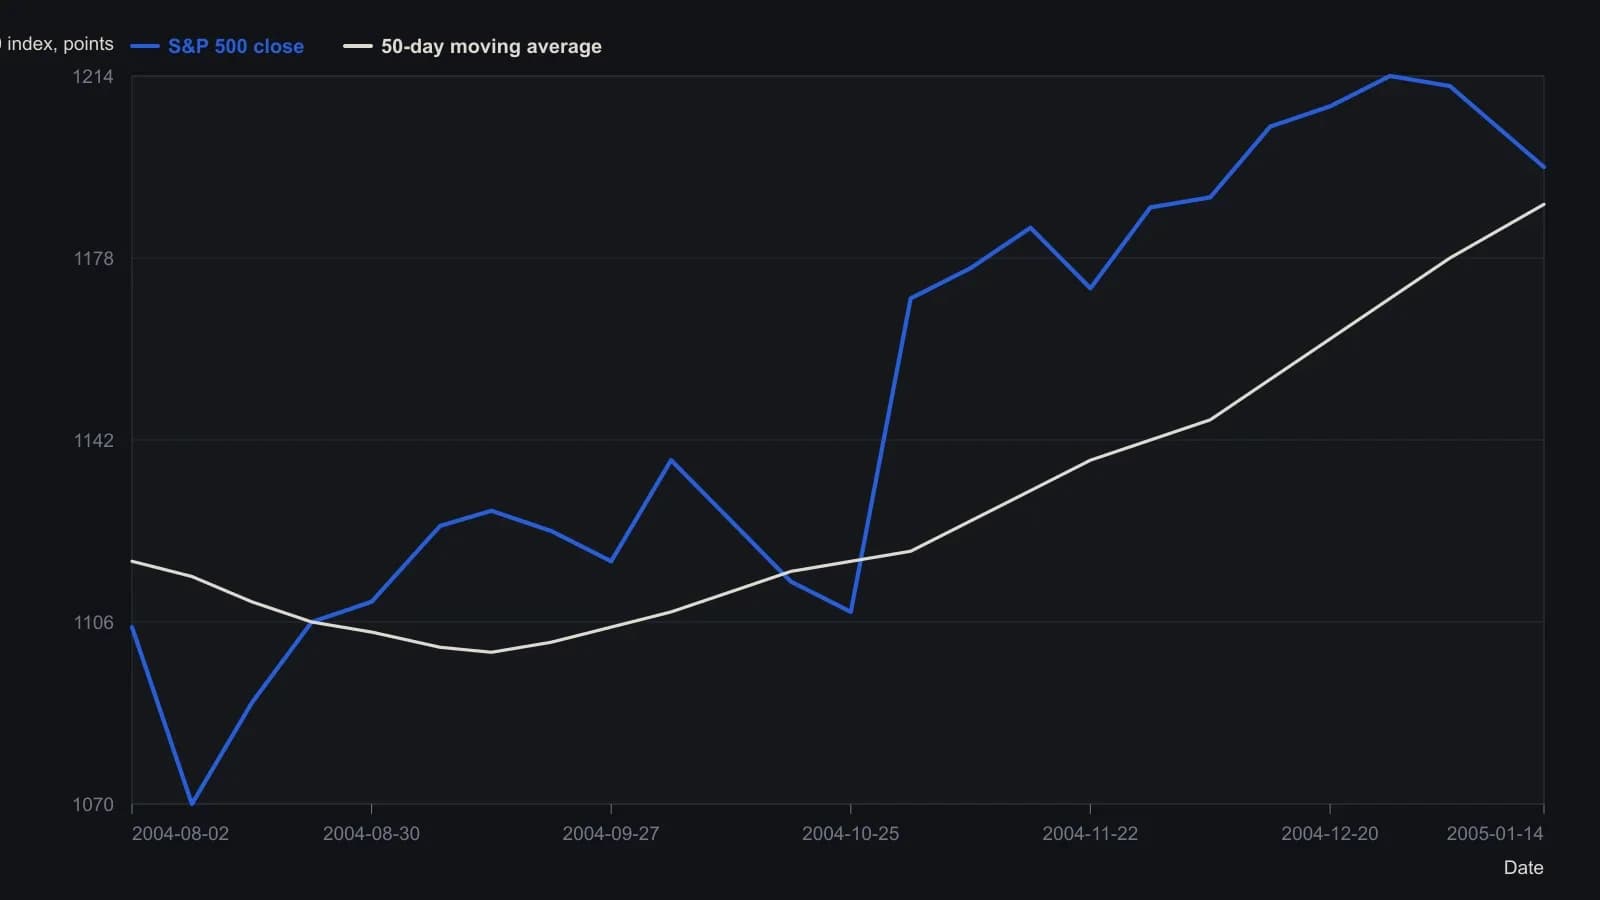
Closes and the average before the final session are read off the 20-point grid to the nearest few index points. The screenshot ends 14 January 2005, before the 18 January break of 1190 described in the column.
The close that left the band
A following session produced a last-hour decline that closed well below the 50-day moving average, after which that average acted as resistance.
On January 14, 2005, the index remained below the 50-day moving average even though the close was near that day's high.
In this case a breakout is a later session in which price leaves the moving-average band that had contained it and then either holds that side or returns to retest the same level on a shorter chart.
A shorter-chart retest of 1190
After an upward bias on January 17, 2005, the index broke back above its 50-day moving average near 1190 on January 18.
On a five-minute e-mini chart, price pulled back to the 1190 breakout area around 8:05 a.m. and then continued higher.
Editorial: The January 18 close-side break supplied the new permission to look only long. The five-minute return to 1190 is the second clock, the retest that treats the break as a hypothesis instead of a finished signal.
Volume into the close
Session volume was observed to surge, more often than not, during the final half hour of trading.
Editorial: That volume habit is why a last-hour close well below the average was read as a more decisive leave of the band than the earlier sessions that finished only a small distance from the line.
All readings on this track · 33 readings
- 1988Opening-range brackets, a two-bar trend filter, and bounded stops
- 1990Bezier-curve price trend filter
- 1992Constructing a damping-index trend filter
- 1992Building a random walk index trend filter
- 1992Phase diagrams for moving-average trend filters
- 1993Volume-weighted change smoothing and trend ranking
- 1993Concurrent highest-low filter with a largest-low-fall trigger
- 1994Unit-invariant trend filters and the c-test
- 1995Constructing cup and cap entries with a three-bar net line
- 1997Why a daily timing evaluation depends on interval, lookbacks, and the fitting objective
- 2001A volume budget clock for trend-segment construction
- 2001Keep three jobs separate when you test a composite score
- 2002Evaluating the weekly four-percent close filter as a market-state procedure
- 2003Constructing a confirmed zigzag trend filter
- 2004Decompose high, low, and close into separate forecast streams
- 2005Three-state moving-average breakout bar coloring
- 2005Constructing a volume and move-adjusted trend filter
- 2005A fifty-day average breakout as a trend permission filter
- 2005Current-bar inclusion can mute a stochastic channel break
- 2006A stochastic oscillator gated by a long-term exponential average
- 2010A construction test for a modified volume-price trend filter
- 2011Constructing a Spearman rank trend filter
- 2013Constructing a repeated-median slope as a resistant trend filter
- 2014Combining a relative-strength index and trend filters for oversold setups
- 2014Price-rooted lookbacks for a relative strength index, a moving average, and a trend filter
- 2015Evaluating next-session intermarket range forecasts
- 2018Read the intermarket weight matrix first, then the predicted moving-average filter
- 2018Constructing the stiffness trend filter from moving-average holds
- 2018The averaging kernel and the lagged trend gate are separate specifications
- 2019A trend filter is not ready to compare until portfolio constraints are written down
- 2019Lookback, threshold, and position-capacity for a stiffness trend-filter
- 2020Combining a trend filter with a moving average and a stochastic oscillator
- 2020Constructing a relative-strength oscillator with a rank-agreement trend filter