1988issue C121-3
Remaining life on a percent-filtered swing chart
A percent trend-filter can drop small swings and leave a swing-chart that is kin to point-and-figure. Once a swing is qualified, remaining-life asks how much unused travel is still left, and how sharply that remainder shrinks when the swing fights the primary trend.
- A percent trend-filter drops any swing smaller than a stated threshold, illustrated as 5 percent on market averages and 10 percent on individual stocks, and the cleaned path is treated as kin to a point-and-figure chart.
- Qualified advances and declines are labeled as percent-swings by resetting the swing low to 100, so a rise from 100 to 130 and a later fall from 130 to 100 both receive a 30 percent tag.
- After a swing clears the filter, its direction is used as an indicator because such swings historically tend to continue. Remaining-life is the extra percent travel observed, on average, before a reversal larger than the filter.
- Remaining-life was similar for upswings and downswings, but primary-trend-alignment changed it substantially: with-trend swings kept more unused travel than swings that fought the prevailing bull or bear market.
A percent filter builds the swing-chart
A percent trend-filter can drop any swing smaller than a stated threshold. The archive illustrates that gate as 5 percent on market averages and 10 percent on individual stocks.
The cleaned record is a swing-chart. It keeps only turning points large enough to pass the chosen percent threshold and drops the smaller vibrations between those turns. The trend-filter withholds a reversal from the swing record until the move exceeds that stated size, so remaining-life estimates use only qualified swings.
The same ignore rule as point-and-figure
The cleaned swing path is treated as kin to a point-and-figure chart. Point-and-figure likewise suppresses moves smaller than a chosen box or point size and produces a cleaned sequence of advances and declines.
How a percent-swing is labeled
Rising and falling swings are put on the same scale by treating the swing low as 100. A move from 100 to 130 and a later move from 130 to 100 are both labeled 30 percent, even though the decline is about 23 percent from the high. That shared tag is the percent-swing of the qualified advance or decline.
Direction after the filter
After a swing clears the filter and is no longer treated as chart noise, its direction is used as an indicator because such swings historically tend to continue.
Remaining-life on qualified swings
Remaining-life is the additional percent travel historically observed, on average, before a reversal larger than the filter ends the current swing.
Remaining swing size was estimated from a historical file of 785 industrial-average swings of 5 percent or more running back to 1897. In that file, a swing already measuring 7 percent continued, on average, to 12.3 percent before a reversal larger than the 5 percent filter.
Primary-trend-alignment changes the remainder
Remaining-size curves for upswings and downswings were not significantly different from each other. Remaining size did differ substantially by primary-trend-alignment, meaning whether the current swing traveled with or against the prevailing bull or bear market. That split includes secondary reactions and bear-market rallies.
In a rising primary market, a 7 percent advance averaged continuation to 14 percent. A decline in the same regime averaged only 4 percent of additional travel, to about 11 percent.
Remaining travel on a 5% DJIA swing after it has already run
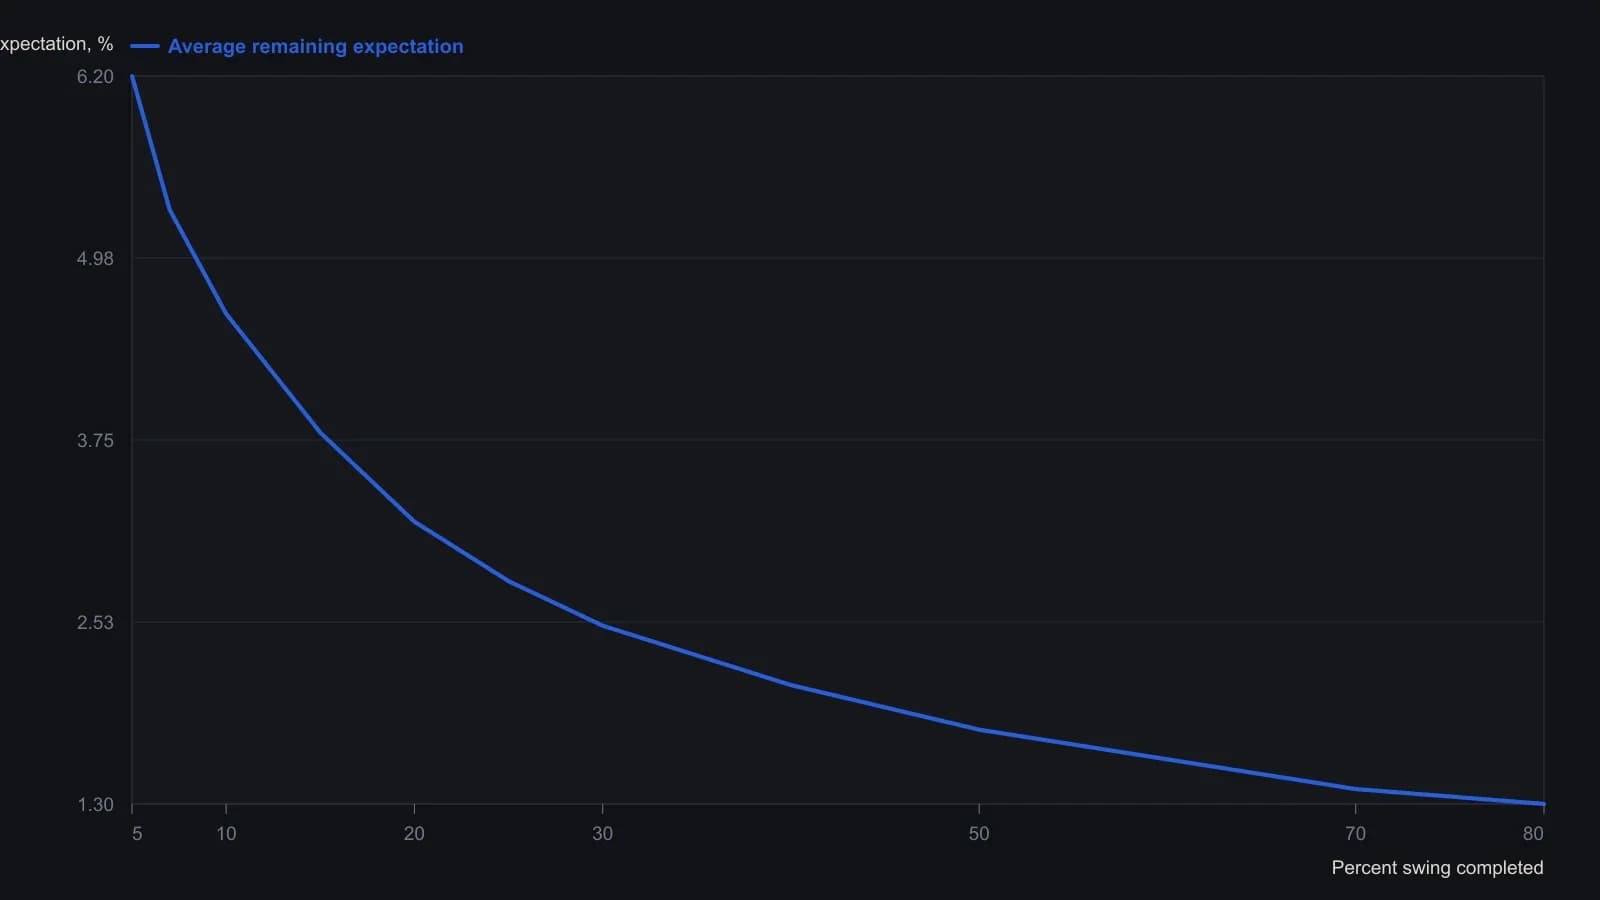
Y is remaining life in percent (expected terminal size minus the observed completed size). The 7%→12.3% pair is stated in the article; other points are digitized from Figure 2. Filter is 5% on the DJIA. Sample is 785 swings from 1897.
All readings on this track · 30 readings
- 1982Constructing range resistance from harmonic swing divisions
- 1984Gold swing chart: failed highs, wash-out, and a boxed pivot range
- 1988Remaining life on a percent-filtered swing chart
- 1991Ranking turning points with percentage swing filters
- 1991Five-count swing-chart construction and break rules
- 1992Constructing the Gann quarterly swing from the prior quarter's intraday range
- 1992Audit quarterly swing breakouts with a slower average cross
- 1992Weekly swing invalidation and the trailing stop
- 1992Quarterly swing chart construction and trend duration
- 1998A two-bar swing is unfinished until it names the stop
- 1999Multiple time-frame swing-channel trade setups
- 1999Separate two-bar swing direction from peak-valley trend
- 2000Constructing peak-trough swing reversals
- 2002Swing charts as shared grammar for trading mentorship
- 2002Confirming the last leg of a zigzag trend filter
- 2004When a late trend bends: test the pause before sizing a reversal
- 2006Crude oil swing counts and cycle clusters
- 2006When late rallies flatten: a swing-chart classroom
- 2006Relocating trading certainty to the decision process
- 2008Swing highs, bar-count pace, and the cost-price stop
- 2010Constructing suspect versus confirmed swing trends
- 2010Constructing swing charts from clear bar ranges
- 2010Building price force maps from two-bar swings
- 2010Clear-method swing-chart construction
- 2011Treat a squared-chart swing forecast as a same-day hypothesis
- 2012Cycle mode construction from aligned bandpass swing waves
- 2013Stacked swing lows and breakout retrace tests
- 2015Building swing charts from perceptually important points
- 2015Construct a zztop from perceptually important points
- 2016Isolating swings with percentage trend thresholds