2010issue C0422-29
A construction test for a modified volume-price trend filter
Editorial aim: teach a construction test for a volume-signed running sum. Neutralize volume and match scales until the filter sits on log price, then treat only leftover slope as a staged-flow reading.
- The construction looks for interday staged buying or selling of a large stake from price and volume, comparing prints across successive days rather than the same day's open and close.
- A full-volume cumulative filter adds or subtracts each bar's entire volume and is typically choppier than price, while a volume-price increment applies only a share of volume in proportion to the fractional price change.
- A same-bar average of open, high, low, and close pulls the path closer to price when no staged flow is present, and a level shift plus a scale factor align a linear trend filter to log price.
- Leftover slope is the staged-flow reading. The modified filter's direction is treated as the earlier reading for later price direction, and new alignment factors are fitted only between region breaks.
What the construction targets
The construction targets interday staged buying or selling of a large stake. It uses only price and volume. It compares prints across successive days rather than the same day's open and close.
The full-volume filter
A full-volume cumulative filter starts at the first bar's volume and then adds or subtracts each later bar's entire volume according to the sign of the close-to-close change, even when that change is tiny.
Because every bar contributes its full volume, that filter is typically choppier than price. The extra movement can hide a genuine flow imbalance or suggest one that is not there.
The volume-price increment
A volume-price increment applies only a share of the bar's volume in proportion to the fractional price change. This increment removes much of the day-to-day jumpiness of the full-volume series.
Replacing the close
A moving average here is a same-bar average of open, high, low, and close. It replaces a single close in the increment and is compared with the prior bar's average. Replacing the close in this way pulls the volume-price path closer to price when no staged flow is present.
Matching the filter to log price
The modified overlay plots price on a logarithmic scale and the trend filter on a linear scale. A level shift and a scale factor are then applied so leftover slope can be inspected after alignment. The trend filter is a cumulative, volume-weighted price-change series aligned to price so residual slope can be read as staged buying or selling.
When every volume observation is replaced by the constant 1, a linear-on-linear overlay still leaves the paths far apart. Log price against a linear filter produces a near match.
Reading leftover slope
During residual slope disagreement, the construction treats the direction of the modified filter as the earlier reading for later price direction.
Region breaks
A sharp gap on unusually large volume is treated as a region break. New level and scale factors are fitted only between breaks. Flattening those jumps would blunt later slope disagreement.
After a market-wide crash
After a market-wide crash, leftover slope at the individual-stock level can become scarce. A common market force may dominate local series, or staged campaigns themselves may become rarer.
MVPT leftover slope on Durban Roodepoort Deep
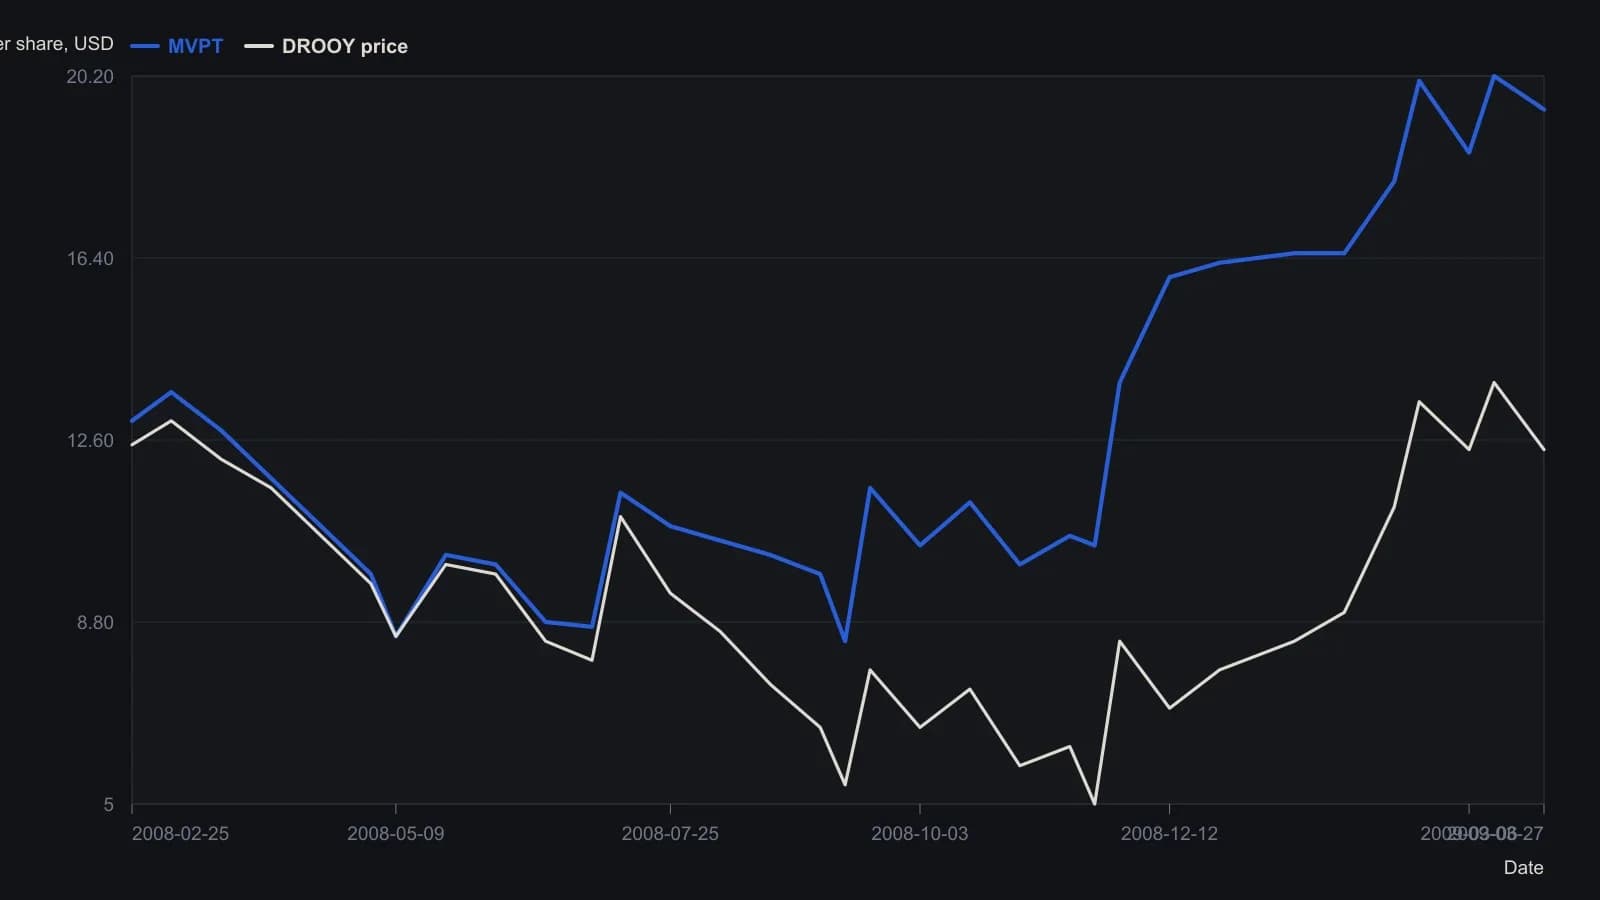
Hawkins fitted MVPT only from late February through early May 2008. A late-November gap is a discontinuity after which the same level and scale no longer apply. The upper on-balance-volume pane stayed flat to slightly down across that autumn window, so the leftover slope is specific to the modified filter. Overlay readings are the fitted plot against the dollar axis, not the raw left-hand MVPT numbers (about 1.73–1.80).
All readings on this track · 33 readings
- 1988Opening-range brackets, a two-bar trend filter, and bounded stops
- 1990Bezier-curve price trend filter
- 1992Constructing a damping-index trend filter
- 1992Building a random walk index trend filter
- 1992Phase diagrams for moving-average trend filters
- 1993Volume-weighted change smoothing and trend ranking
- 1993Concurrent highest-low filter with a largest-low-fall trigger
- 1994Unit-invariant trend filters and the c-test
- 1995Constructing cup and cap entries with a three-bar net line
- 1997Why a daily timing evaluation depends on interval, lookbacks, and the fitting objective
- 2001A volume budget clock for trend-segment construction
- 2001Keep three jobs separate when you test a composite score
- 2002Evaluating the weekly four-percent close filter as a market-state procedure
- 2003Constructing a confirmed zigzag trend filter
- 2004Decompose high, low, and close into separate forecast streams
- 2005Three-state moving-average breakout bar coloring
- 2005Constructing a volume and move-adjusted trend filter
- 2005A fifty-day average breakout as a trend permission filter
- 2005Current-bar inclusion can mute a stochastic channel break
- 2006A stochastic oscillator gated by a long-term exponential average
- 2010A construction test for a modified volume-price trend filter
- 2011Constructing a Spearman rank trend filter
- 2013Constructing a repeated-median slope as a resistant trend filter
- 2014Combining a relative-strength index and trend filters for oversold setups
- 2014Price-rooted lookbacks for a relative strength index, a moving average, and a trend filter
- 2015Evaluating next-session intermarket range forecasts
- 2018Read the intermarket weight matrix first, then the predicted moving-average filter
- 2018Constructing the stiffness trend filter from moving-average holds
- 2018The averaging kernel and the lagged trend gate are separate specifications
- 2019A trend filter is not ready to compare until portfolio constraints are written down
- 2019Lookback, threshold, and position-capacity for a stiffness trend-filter
- 2020Combining a trend filter with a moving average and a stochastic oscillator
- 2020Constructing a relative-strength oscillator with a rank-agreement trend filter