2005issue C031-4
Constructing a volume and move-adjusted trend filter
Keep the lookback fixed and treat an equal-weight average of closes as a historical noise filter. Move size and volume enter the weights only as named continuation hypotheses that can be compared with that unadjusted baseline.
- An average of closes, with any lookback or any linear or exponential decay, only locates the history of the series and does not, by itself, state a future direction.
- A directional reading is treated as possible only after an extra series that can lead price, such as move size or volume, is written into the weights.
- The combined-volume-move-average is the arithmetic mean of a move-adjusted average and a volume-adjusted average that share the same lookback.
- When successive absolute price changes are identical, the move-adjusted average coincides with a simple average, so only the volume weights can change timing or shape.
What a moving average records
An average of ordered closes, with any lookback or any linear or exponential decay of those closes, only locates the history of the series. It does not, by itself, state a future direction. Without extra inputs, that moving average only describes the path already observed over a chosen lookback.
The lookback is the fixed count of bars whose closes, absolute changes, and volumes later enter the two weight vectors. Until those extra series are written in, the average remains a record of history, not a statement of future direction.
How move size and volume enter the weights
A directional reading from an average is treated as possible only after an extra series that can lead price, such as move size or volume, is written into the weights.
The move-adjusted average divides each bar’s absolute close-to-close change by the sum of those absolute changes over the lookback, counting the change into the first lookback close from the prior close outside the window, then sums the closes times those shares.
A separate volume-adjusted average divides each bar’s volume by the sum of volume in the same lookback and sums the closes times those shares. Volume-price analysis, in this construction, uses the volume that accompanies each close-to-close change to raise or lower that bar’s share of the average.
The combined-volume-move-average is the arithmetic mean of the move-adjusted average and the volume-adjusted average. After move size and volume have been written into the weights, that constructed line is the trend filter used to separate directional persistence from noise.
Equal move weights and constructed paths
When successive absolute price changes are identical, the move weights are equal, so the move-adjusted average coincides with a simple average and only the volume weights can change timing or shape.
On a constructed path where volume bottoms at price peaks and troughs and tops as price crosses the midpoint, the combined line turns after a trough and after a peak sooner than the move-only line and tracks a smoother path than either the move-only line or a simple average.
On a constructed path where volume extrema coincide with price extrema, the combined line has larger amplitude than the move-only line and changes more promptly than the move-only line or a simple average.
How volume raises or lowers a bar’s share
A large same-direction change on heavy volume receives more weight than a large change on light volume. A light-volume thrust that then reverses on heavy volume is reduced in the combined average.
Fading volume into a range extreme is presented as consistent with remaining inside the range, while rising volume into an extreme is presented as a reason the combined line should respond faster if the move continues or the range breaks.
Four-period VOMOMA compared with MOMA, VOMA and close
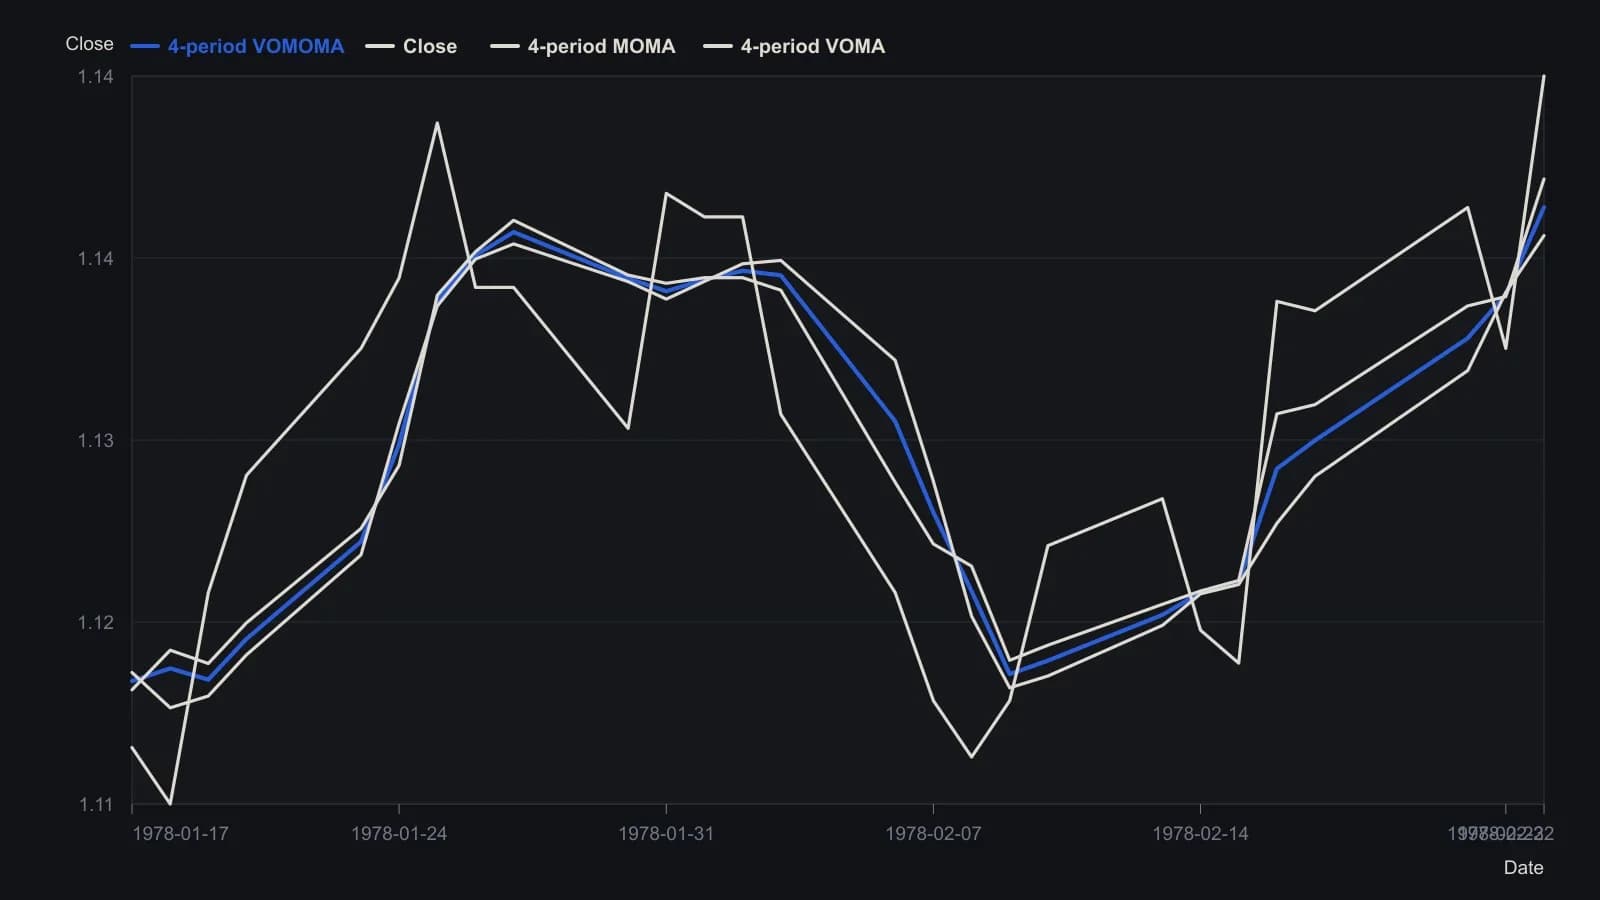
Lookback is fixed at four periods, as in the sidebar worksheet. VOMOMA is defined there as the mean of that MOMA and the matching volume-weighted average (VOMA).
All readings on this track · 33 readings
- 1988Opening-range brackets, a two-bar trend filter, and bounded stops
- 1990Bezier-curve price trend filter
- 1992Constructing a damping-index trend filter
- 1992Building a random walk index trend filter
- 1992Phase diagrams for moving-average trend filters
- 1993Volume-weighted change smoothing and trend ranking
- 1993Concurrent highest-low filter with a largest-low-fall trigger
- 1994Unit-invariant trend filters and the c-test
- 1995Constructing cup and cap entries with a three-bar net line
- 1997Why a daily timing evaluation depends on interval, lookbacks, and the fitting objective
- 2001A volume budget clock for trend-segment construction
- 2001Keep three jobs separate when you test a composite score
- 2002Evaluating the weekly four-percent close filter as a market-state procedure
- 2003Constructing a confirmed zigzag trend filter
- 2004Decompose high, low, and close into separate forecast streams
- 2005Three-state moving-average breakout bar coloring
- 2005Constructing a volume and move-adjusted trend filter
- 2005A fifty-day average breakout as a trend permission filter
- 2005Current-bar inclusion can mute a stochastic channel break
- 2006A stochastic oscillator gated by a long-term exponential average
- 2010A construction test for a modified volume-price trend filter
- 2011Constructing a Spearman rank trend filter
- 2013Constructing a repeated-median slope as a resistant trend filter
- 2014Combining a relative-strength index and trend filters for oversold setups
- 2014Price-rooted lookbacks for a relative strength index, a moving average, and a trend filter
- 2015Evaluating next-session intermarket range forecasts
- 2018Read the intermarket weight matrix first, then the predicted moving-average filter
- 2018Constructing the stiffness trend filter from moving-average holds
- 2018The averaging kernel and the lagged trend gate are separate specifications
- 2019A trend filter is not ready to compare until portfolio constraints are written down
- 2019Lookback, threshold, and position-capacity for a stiffness trend-filter
- 2020Combining a trend filter with a moving average and a stochastic oscillator
- 2020Constructing a relative-strength oscillator with a rank-agreement trend filter