2018issue C0343-45
Read the intermarket weight matrix first, then the predicted moving-average filter
A 2018 product case study isolated thirty related markets as a numeric intermarket weight matrix and displayed predicted moving averages beside a typical-price forecast. Editorial teaching: read the matrix as context, then read the predicted stack as a short-horizon trend filter, not as an entry ticket.
- The case study isolated thirty related markets and stored their influence as an intermarket weight matrix, rather than as a single pairwise correlation.
- The visible stack included predicted short-term, medium-term, and long-term moving-average crossovers and differences, plus a predicted next-session high and low range.
- One index compared a current three-day moving average with a predicted three-day moving average to state whether typical price would be higher or lower two days later.
- The software did not generate buy or sell instructions. Users were expected to combine the near-term directional output with their own reading of the target market.
A two-layer chart read
A 2018 product case study described searching daily observations from thousands of global markets to isolate thirty related markets with the greatest influence on a chosen target, then encoding that influence as a numeric intermarket weight matrix.
The same write-up also showed predicted moving averages, predicted differences, a predicted next-session high and low range, and a typical-price forecast. Editorial: read those pieces as two layers. First collapse the global book into the fixed matrix. Then treat the predicted moving-average stack as a short-horizon trend filter on typical price rather than as an entry ticket.
The intermarket weight matrix
The write-up contrasted that multi-market weight construction with computing linear correlations between only two markets at a time.
An intermarket weight matrix is a fixed set of related markets, here thirty, whose influence on one target is stored as numeric weights instead of a single pairwise correlation.
Predicted moving averages and typical price
The visible indicator set included predicted short-term, medium-term, and long-term moving-average crossovers; predicted short-term, medium-term, and long-term differences; and a predicted next-session high and low range.
A predicted moving average is a moving-average line whose level is generated from a short-horizon forecast rather than from completed prices alone.
One undisclosed index compared the current three-day moving average with a predicted three-day moving average to forecast whether typical price would be higher or lower two days later. A typical-price forecast is a two-day-ahead statement of whether the average of high, low, and close is expected to be higher or lower.
Predicted vs actual medium-term moving averages, Annaly Capital (NLY)
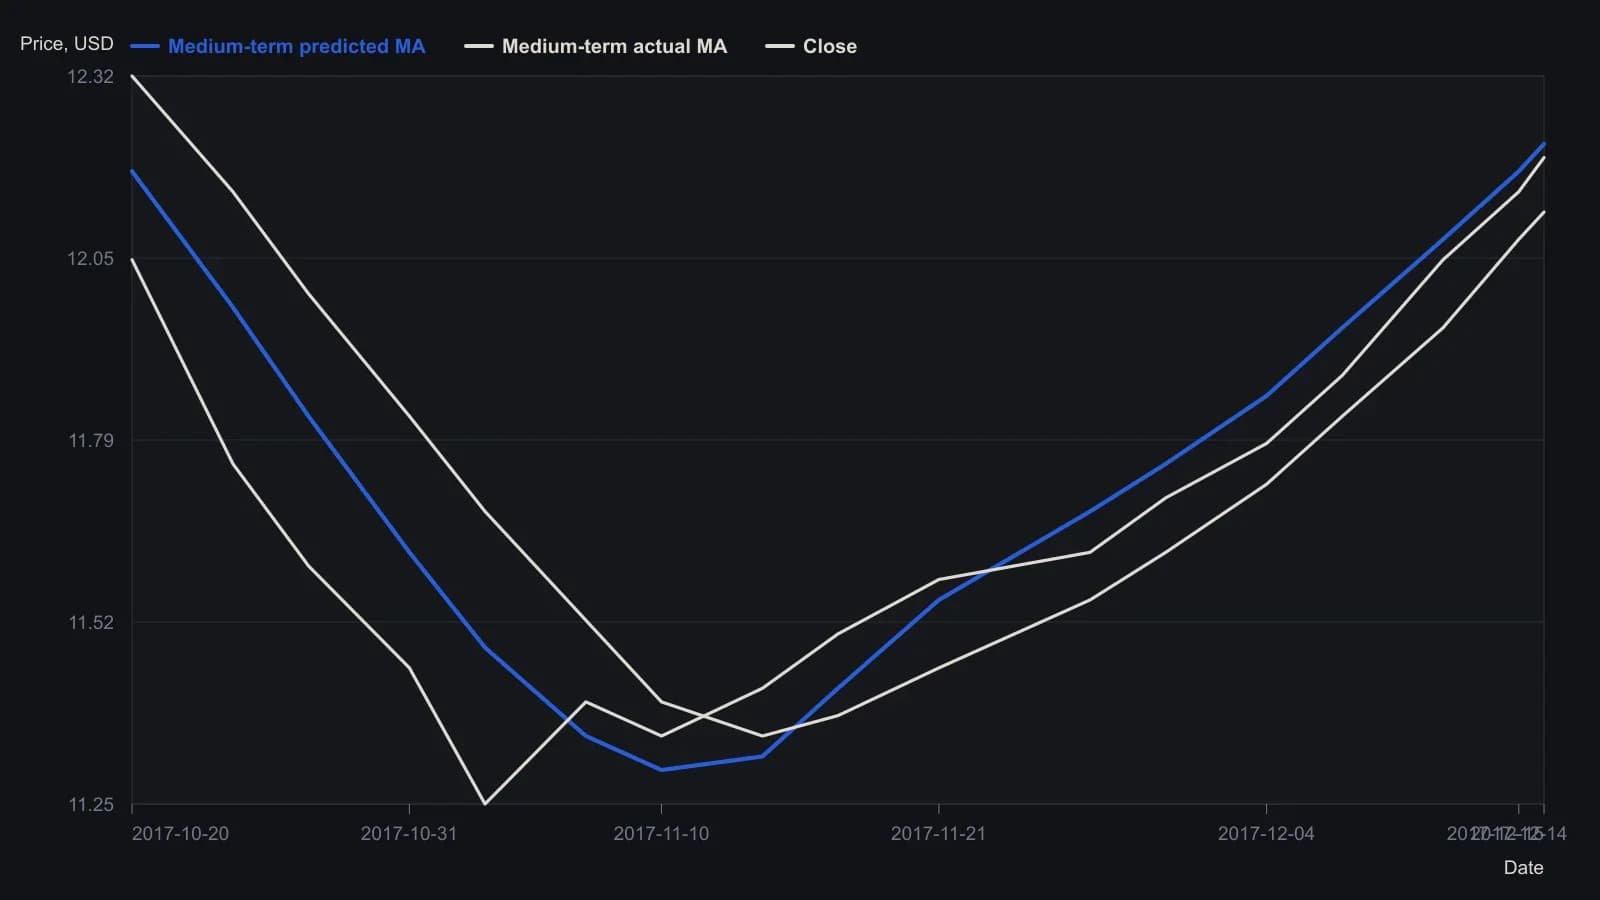
Digitized from the lower pane of the page-43 screenshot (daily bars, Medium-Predict vs Medium-Actual). Y values are approximate to about 0.05 dollar; the review does not print the series. NeuralXMax and the candlesticks themselves were not transcribed.
A trend filter, not a ticket
An accompanying chart used green shading for bullish trend segments and red shading for bearish segments when illustrating forecasted trend direction from predictive moving averages.
Editorial: treat that shading as a trend filter, a directional overlay that marks bullish versus bearish segments without issuing an entry or exit instruction.
The software was described as not generating buy or sell instructions. Users were expected to combine the near-term directional output with their own reading of the target market.
Coverage and a detached market scan
Listed coverage included close to 2,000 symbols spanning futures groups, 13 major and 21 cross currency pairs, multiple ETF categories, and US and Canadian stocks, plus near-term movement forecasts for bitcoin, Ethereum, and Litecoin.
Forecast calculations were moved to a remote server so chart data appeared when a chart was opened. A market-scan function was detached from portfolios and charts so multiple scans could be stored independently. A market scan is a saved, chart-independent screen that ranks a chosen universe by the same predicted indicators.
How the write-up described the patents
The case study cited a 2013 patent on locating related intermarkets and a second patent on converting lagging indicators into leading indicators intended to forecast trend and trend change a few days ahead.
The second patent is the leading transformation in this article: a claimed recast of a lagging average into a few-days-ahead reading of trend and trend change.
All readings on this track · 33 readings
- 1988Opening-range brackets, a two-bar trend filter, and bounded stops
- 1990Bezier-curve price trend filter
- 1992Constructing a damping-index trend filter
- 1992Building a random walk index trend filter
- 1992Phase diagrams for moving-average trend filters
- 1993Volume-weighted change smoothing and trend ranking
- 1993Concurrent highest-low filter with a largest-low-fall trigger
- 1994Unit-invariant trend filters and the c-test
- 1995Constructing cup and cap entries with a three-bar net line
- 1997Why a daily timing evaluation depends on interval, lookbacks, and the fitting objective
- 2001A volume budget clock for trend-segment construction
- 2001Keep three jobs separate when you test a composite score
- 2002Evaluating the weekly four-percent close filter as a market-state procedure
- 2003Constructing a confirmed zigzag trend filter
- 2004Decompose high, low, and close into separate forecast streams
- 2005Three-state moving-average breakout bar coloring
- 2005Constructing a volume and move-adjusted trend filter
- 2005A fifty-day average breakout as a trend permission filter
- 2005Current-bar inclusion can mute a stochastic channel break
- 2006A stochastic oscillator gated by a long-term exponential average
- 2010A construction test for a modified volume-price trend filter
- 2011Constructing a Spearman rank trend filter
- 2013Constructing a repeated-median slope as a resistant trend filter
- 2014Combining a relative-strength index and trend filters for oversold setups
- 2014Price-rooted lookbacks for a relative strength index, a moving average, and a trend filter
- 2015Evaluating next-session intermarket range forecasts
- 2018Read the intermarket weight matrix first, then the predicted moving-average filter
- 2018Constructing the stiffness trend filter from moving-average holds
- 2018The averaging kernel and the lagged trend gate are separate specifications
- 2019A trend filter is not ready to compare until portfolio constraints are written down
- 2019Lookback, threshold, and position-capacity for a stiffness trend-filter
- 2020Combining a trend filter with a moving average and a stochastic oscillator
- 2020Constructing a relative-strength oscillator with a rank-agreement trend filter