2019issue C028
Lookback, threshold, and position-capacity for a stiffness trend-filter
A stiffness-style trend-filter is incomplete until the moving-average lookback, the stiffness-threshold and sampling interval, and the position-capacity queue are specified together. Unused entries are skipped until an exit frees capital.
- The moving-average and the stiffness-period are free inputs that require parameter-retuning when the sampling interval, the instrument's volatility, or prevailing market conditions change.
- A stiffness-threshold turns the series into a trend-filter: a cross above the level is the mechanical long entry and a cross back below it is the exit.
- A visual-range-estimate on the chart sketches a search band for those lookbacks before the parameters are optimized for the chosen interval.
- A surplus-signal-queue drops later entries when cash or implied position-capacity is full, and a round-lot rule can leave more names open than a naive capital-to-size ratio suggests.
Three layers before the filter is complete
A stiffness-style trend-filter is incomplete until three layers are specified together: the moving-average lookback that shapes the series, the stiffness-threshold and sampling interval that turn the reading into entries and exits, and the position-capacity queue that decides which of those signals are allowed to become positions.
Editorial reading: the plot on a chart is not yet a mechanical-trading-system. The system exists only when the filter rules and the capital, lot, and queue constraints are joined as one testable procedure.
Moving-average and stiffness-period
Two lookbacks define the series. The moving-average is a lookback smoother applied to ordered price observations. The stiffness-period is the second lookback on the stiffness calculation. Both are treated as free parameters.
The stiffness series had not been tested on intraday bars in the documented work. Any short-interval use was described as requiring parameter-retuning of the moving-average and stiffness-period inputs to the new sampling interval, the instrument's volatility, and prevailing market conditions.
On a 30-minute futures example the stiffness plot used a moving-average length of 100 and a stiffness-period of 70.
Before treating the filter as a system, the documented procedure was to optimize those parameters after a visual-range-estimate: a chart-side adjustment of the moving-average and stiffness-period controls used to sketch a plausible search band.
Threshold and sampling interval
The same 30-minute example used a stiffness-threshold of 90. A mechanical long entry was taken when the reading crossed above 90, and the position was exited when the reading crossed back below 90.
Editorial reading: the sampling interval belongs in the specification, because a change of bar length means the same numeric lookbacks no longer describe the same trend-filter.
Stiffness on 30-minute Nasdaq June 2018 futures (NQM8)
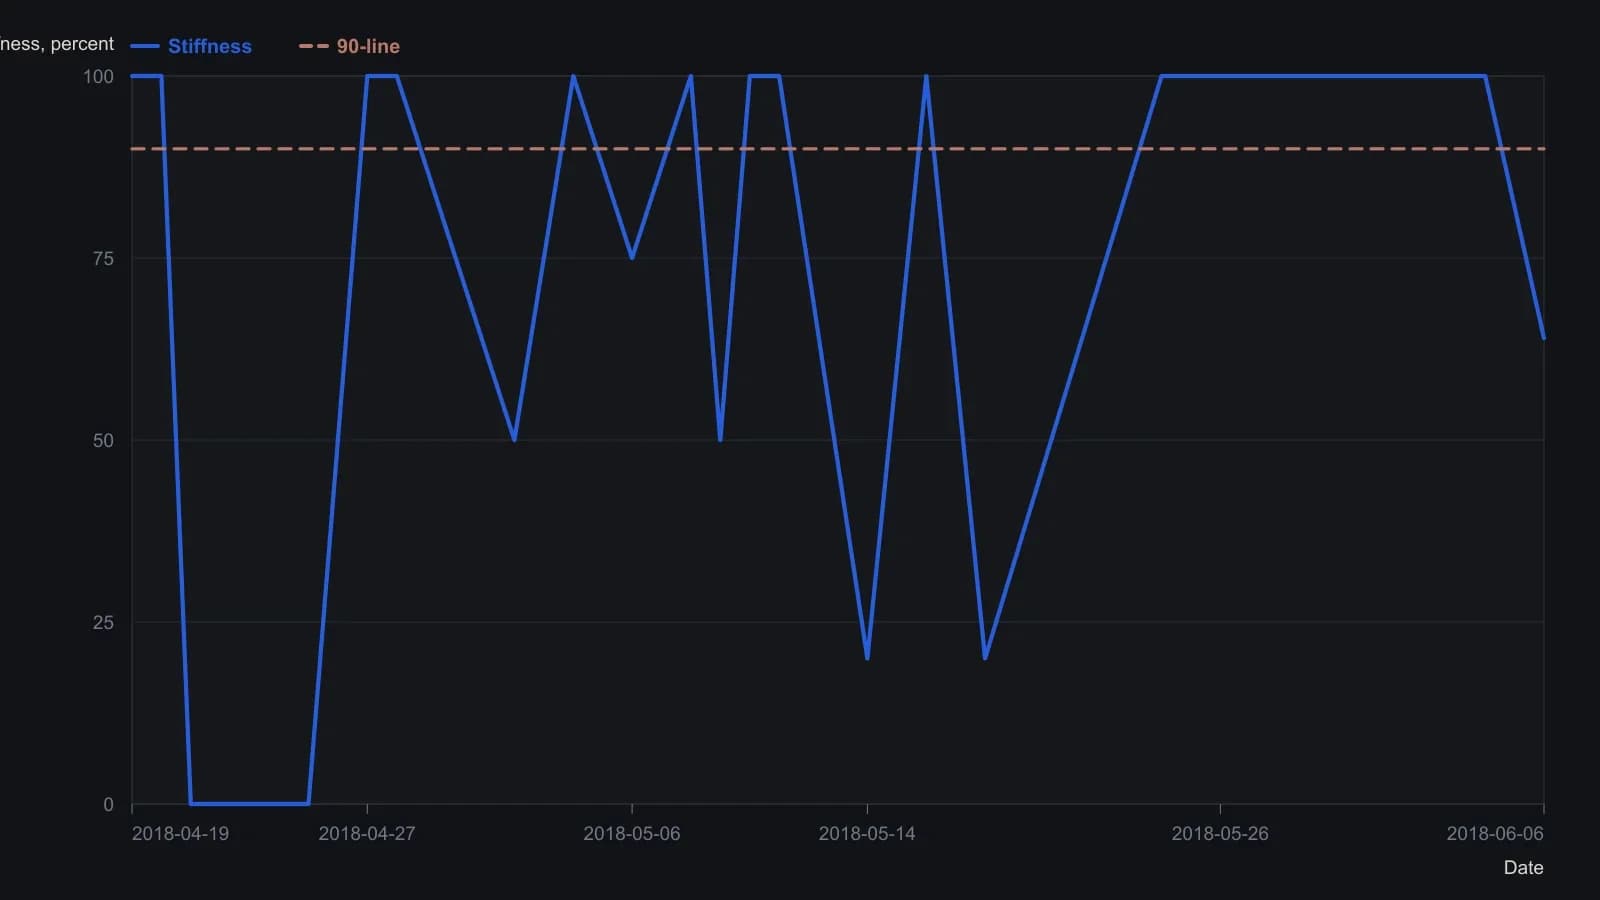
The pane is labelled Stiffness(100,70,0.2) with an MA(100) overlay on price. The 0.2 argument is printed on the chart but not defined in the letter. Turning-point dates and intermediate y-values are approximate because they were digitized from the raster; the 90 threshold is the figure given in prose.
Position-capacity and the surplus-signal-queue
The portfolio test used 200000 of starting capital, a 10000 maximum trade size, a 10-share round-lot, and a 1000 minimum position value. It did not use leverage, margin, or pyramiding.
Those capital rules create position-capacity: an implicit limit on concurrent holdings from starting capital and maximum trade size, before any ranking function is added. Dividing starting capital by maximum trade size implied 20 names.
When more names signaled than cash or that implied limit allowed, later entries were ignored until an exit freed capital. That surplus-signal-queue skips unused entries rather than financing them with leverage or pyramiding. A ranking score was not applied, so larger eligible size was preferred only by the platform default.
Because the round-lot rule kept each fill below the 10000 size cap, the number of concurrent holdings could exceed that 20-name implication.
All readings on this track · 33 readings
- 1988Opening-range brackets, a two-bar trend filter, and bounded stops
- 1990Bezier-curve price trend filter
- 1992Constructing a damping-index trend filter
- 1992Building a random walk index trend filter
- 1992Phase diagrams for moving-average trend filters
- 1993Volume-weighted change smoothing and trend ranking
- 1993Concurrent highest-low filter with a largest-low-fall trigger
- 1994Unit-invariant trend filters and the c-test
- 1995Constructing cup and cap entries with a three-bar net line
- 1997Why a daily timing evaluation depends on interval, lookbacks, and the fitting objective
- 2001A volume budget clock for trend-segment construction
- 2001Keep three jobs separate when you test a composite score
- 2002Evaluating the weekly four-percent close filter as a market-state procedure
- 2003Constructing a confirmed zigzag trend filter
- 2004Decompose high, low, and close into separate forecast streams
- 2005Three-state moving-average breakout bar coloring
- 2005Constructing a volume and move-adjusted trend filter
- 2005A fifty-day average breakout as a trend permission filter
- 2005Current-bar inclusion can mute a stochastic channel break
- 2006A stochastic oscillator gated by a long-term exponential average
- 2010A construction test for a modified volume-price trend filter
- 2011Constructing a Spearman rank trend filter
- 2013Constructing a repeated-median slope as a resistant trend filter
- 2014Combining a relative-strength index and trend filters for oversold setups
- 2014Price-rooted lookbacks for a relative strength index, a moving average, and a trend filter
- 2015Evaluating next-session intermarket range forecasts
- 2018Read the intermarket weight matrix first, then the predicted moving-average filter
- 2018Constructing the stiffness trend filter from moving-average holds
- 2018The averaging kernel and the lagged trend gate are separate specifications
- 2019A trend filter is not ready to compare until portfolio constraints are written down
- 2019Lookback, threshold, and position-capacity for a stiffness trend-filter
- 2020Combining a trend filter with a moving average and a stochastic oscillator
- 2020Constructing a relative-strength oscillator with a rank-agreement trend filter