2001issue C081-5
A volume budget clock for trend-segment construction
The historical workflow estimates trading shares after core holdings are removed, then treats a price trend as unfinished until cumulative volume approximates that budget. Successive segments on the same name can carry similar volume even when they occupy different lengths of time.
- A price trend is treated as unfinished until cumulative volume approximates the estimated number of shares owned by trading holders.
- Successive price-trend segments on the same name can carry similar cumulative volume even when the segments occupy different lengths of time.
- Unused volume after a recent segment-end date locates progress through the current trend but does not identify the direction of the next trend.
- Segments labeled flat stay in the sequence because they locate the start of the next volume segment.
Two inputs and a testable count
In editorial terms, trend construction is a two-input build. Estimate the float that actually trades, then advance a cumulative-volume cursor until that budget is spent, so a channel's likely life is a testable count rather than a visual guess.
The constructed rule treats a price trend as unfinished until cumulative volume approximates the estimated number of shares owned by trading holders. Successive price-trend segments on the same name can carry similar cumulative volume even when the segments occupy different lengths of time.
How the two methods sit in the build
In editorial terms, volume-price analysis turns that repeatable chart condition into a falsifiable trade hypothesis by pairing OHLC structure with a share-turnover budget read from price and scale.
A trend filter then supplies a dated, lookback-based partition of ordered price and volume. It compares an explicit quantitative baseline with later out-of-sample segment ends and does not forecast next-trend direction.
The five-holder illustration
In the five-holder illustration, only the two trading holders produce the four prints, so cumulative volume is twice the trading-share count and locked long-term holders never set the price.
Core holdings are institutional or individual positions treated as locked away and therefore excluded from the trading-share estimate. Locked long-term holders never set the price.
Two ways to estimate trading shares
Trading shares can be estimated by subtracting institutional and individual core holdings from shares outstanding, or by totaling volume from a clear overbought or oversold extreme through the end of the next trend.
Dating the volume segments
A volume segment is a mechanically dated interval that starts after the prior volume budget is filled and ends when that budget is filled again.
A 100-million-share trading-share estimate after a late-June 1999 earnings shortfall produced twelve successive 100-million-share segments from July 1999 through March 2001. Of the nine segments that contained a directional extreme, eight ended on the observed peak or trough or missed by about a day, and those dates were taken from weekly volume totals without consulting the price chart.
In editorial terms, reading the ends from weekly volume totals, without consulting the price chart, is the trend filter's comparison of the baseline with later segment ends. It is not a call on the next trend's direction.
Segments whose opening and closing prices differed by less than 10 percent were labeled flat and still kept in the sequence because they locate the start of the next trend segment. The same volume-budget construction dated major trend segments on other large-capitalization names that used different trading-share estimates, including 230 million and 135 million.
Enron daily price while the 140-million-share budget was running
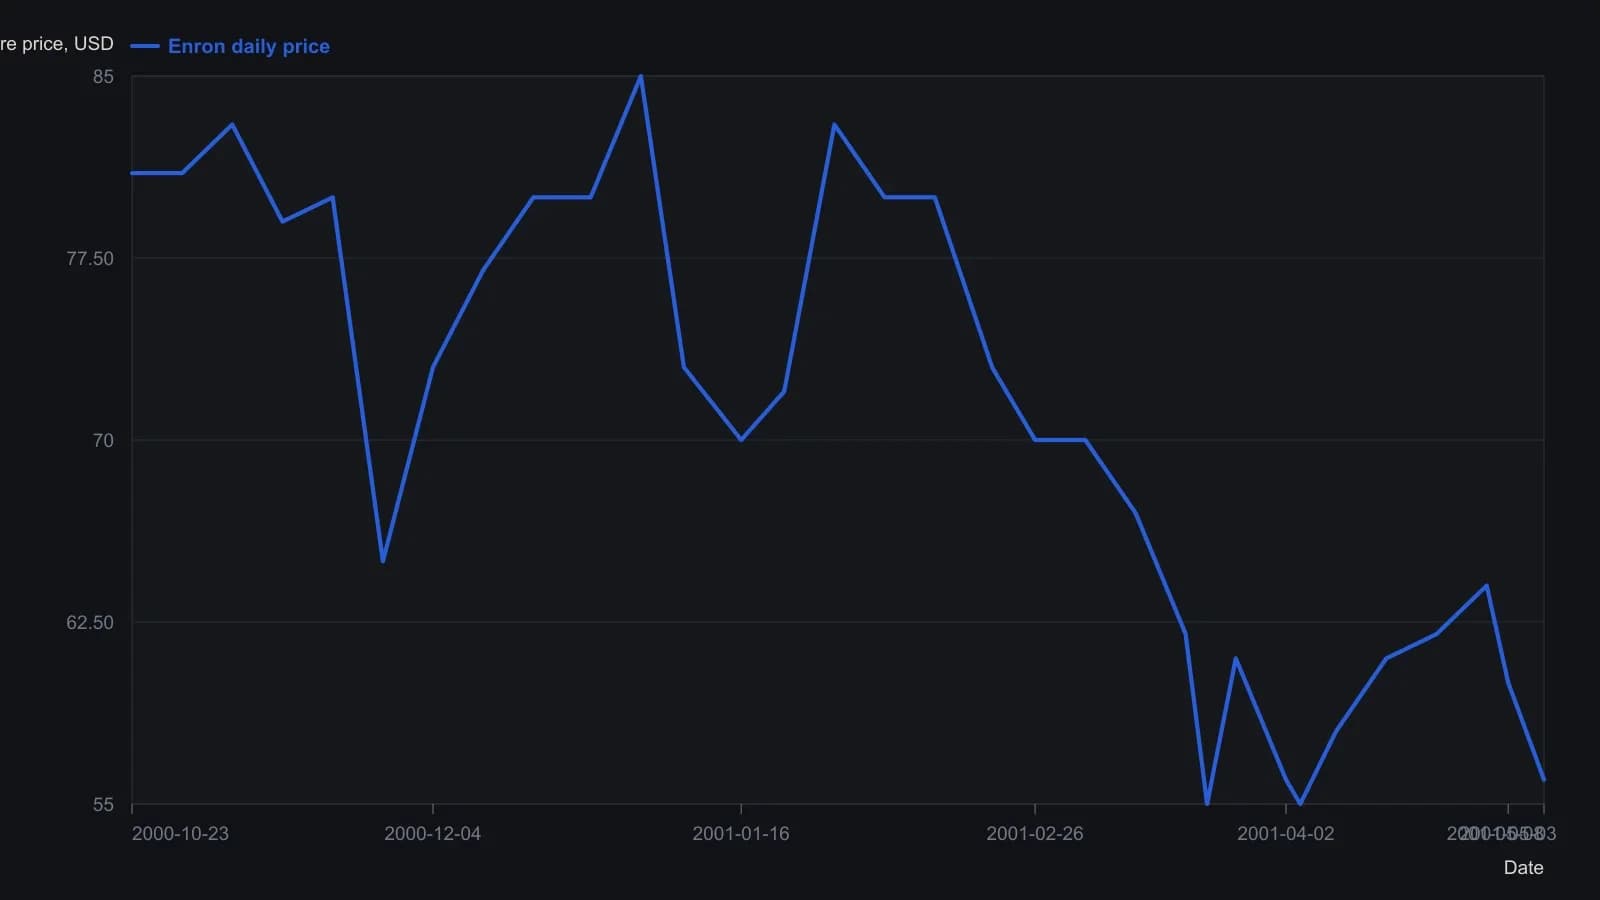
Prices are digitized from the raster and are only good to about one dollar. The 46.4 / 115.4 / 126.4 million cumulative-volume checkpoints are taken from the article text, not from the volume pane. Point C is dated three trading sessions after 3 May 2001.
All readings on this track · 33 readings
- 1988Opening-range brackets, a two-bar trend filter, and bounded stops
- 1990Bezier-curve price trend filter
- 1992Constructing a damping-index trend filter
- 1992Building a random walk index trend filter
- 1992Phase diagrams for moving-average trend filters
- 1993Volume-weighted change smoothing and trend ranking
- 1993Concurrent highest-low filter with a largest-low-fall trigger
- 1994Unit-invariant trend filters and the c-test
- 1995Constructing cup and cap entries with a three-bar net line
- 1997Why a daily timing evaluation depends on interval, lookbacks, and the fitting objective
- 2001A volume budget clock for trend-segment construction
- 2001Keep three jobs separate when you test a composite score
- 2002Evaluating the weekly four-percent close filter as a market-state procedure
- 2003Constructing a confirmed zigzag trend filter
- 2004Decompose high, low, and close into separate forecast streams
- 2005Three-state moving-average breakout bar coloring
- 2005Constructing a volume and move-adjusted trend filter
- 2005A fifty-day average breakout as a trend permission filter
- 2005Current-bar inclusion can mute a stochastic channel break
- 2006A stochastic oscillator gated by a long-term exponential average
- 2010A construction test for a modified volume-price trend filter
- 2011Constructing a Spearman rank trend filter
- 2013Constructing a repeated-median slope as a resistant trend filter
- 2014Combining a relative-strength index and trend filters for oversold setups
- 2014Price-rooted lookbacks for a relative strength index, a moving average, and a trend filter
- 2015Evaluating next-session intermarket range forecasts
- 2018Read the intermarket weight matrix first, then the predicted moving-average filter
- 2018Constructing the stiffness trend filter from moving-average holds
- 2018The averaging kernel and the lagged trend gate are separate specifications
- 2019A trend filter is not ready to compare until portfolio constraints are written down
- 2019Lookback, threshold, and position-capacity for a stiffness trend-filter
- 2020Combining a trend filter with a moving average and a stochastic oscillator
- 2020Constructing a relative-strength oscillator with a rank-agreement trend filter