1989issue C061-7
Weekday price paths are regime-dependent
From December 23, 1986 through January 11, 1989, each weekday path chained only that day's close-to-close ratio and then held flat. Tuesday was the most consistent path, Wednesday flattened against a still-rising market, and Thursday reversed after the 1987 crash. Editorial: a calendar filter is incomplete without a regime gate that withholds the same weekday after a regime break.
- A weekday path compounds only one named day's close-to-close ratio and stays unchanged until that weekday returns.
- In the 1986-1989 sample, Tuesday was the most consistent path, Wednesday flattened against a still-rising market, and Thursday had the sharpest slope change after the 1987 crash.
- Monday was an up day less than 50 percent of the time, and its large negative contribution was concentrated on October 19, 1987, yet a Monday path that omitted that session still sloped down.
- Editorial: run a calendar filter only behind a regime gate that withholds the same weekday after the weekday path flattens or reverses.
How a weekday path is built
A weekday path is a compounded close-to-close series that updates only on one named trading day and stays unchanged until that weekday returns. On that day the path chains the session close-to-close ratio, the current close divided by the prior trading session close, onto the prior cumulative value. Until the same weekday returns, the path is held flat.
From December 23, 1986 through January 11, 1989, each weekday had about 100 sample sessions. Each weekday path chained that day's close-to-close ratio onto the prior cumulative value, then held flat until the same weekday returned.
What the sample window showed
In that window, Tuesday and Wednesday closes rose more often than Thursday and Friday closes, and Monday was an up day less than 50 percent of the time. Those counts are day-of-week tendencies: a repeated weekday-level tilt toward gain, loss, or flat change inside a stated sample window. Tuesday produced the most consistent weekday path in the sample. Friday did not display a stronger weekday path than Tuesday, Wednesday, or Thursday.
Monday's large negative contribution in that window was concentrated on October 19, 1987. A Monday path that omitted that crash session still showed a fairly steady downward close-to-close tendency.
Over the same roughly two-year span the broad market spent most of its time in an uptrend, so weekday paths have to be read against a rising backdrop.
S&P 500 up-day frequency by weekday
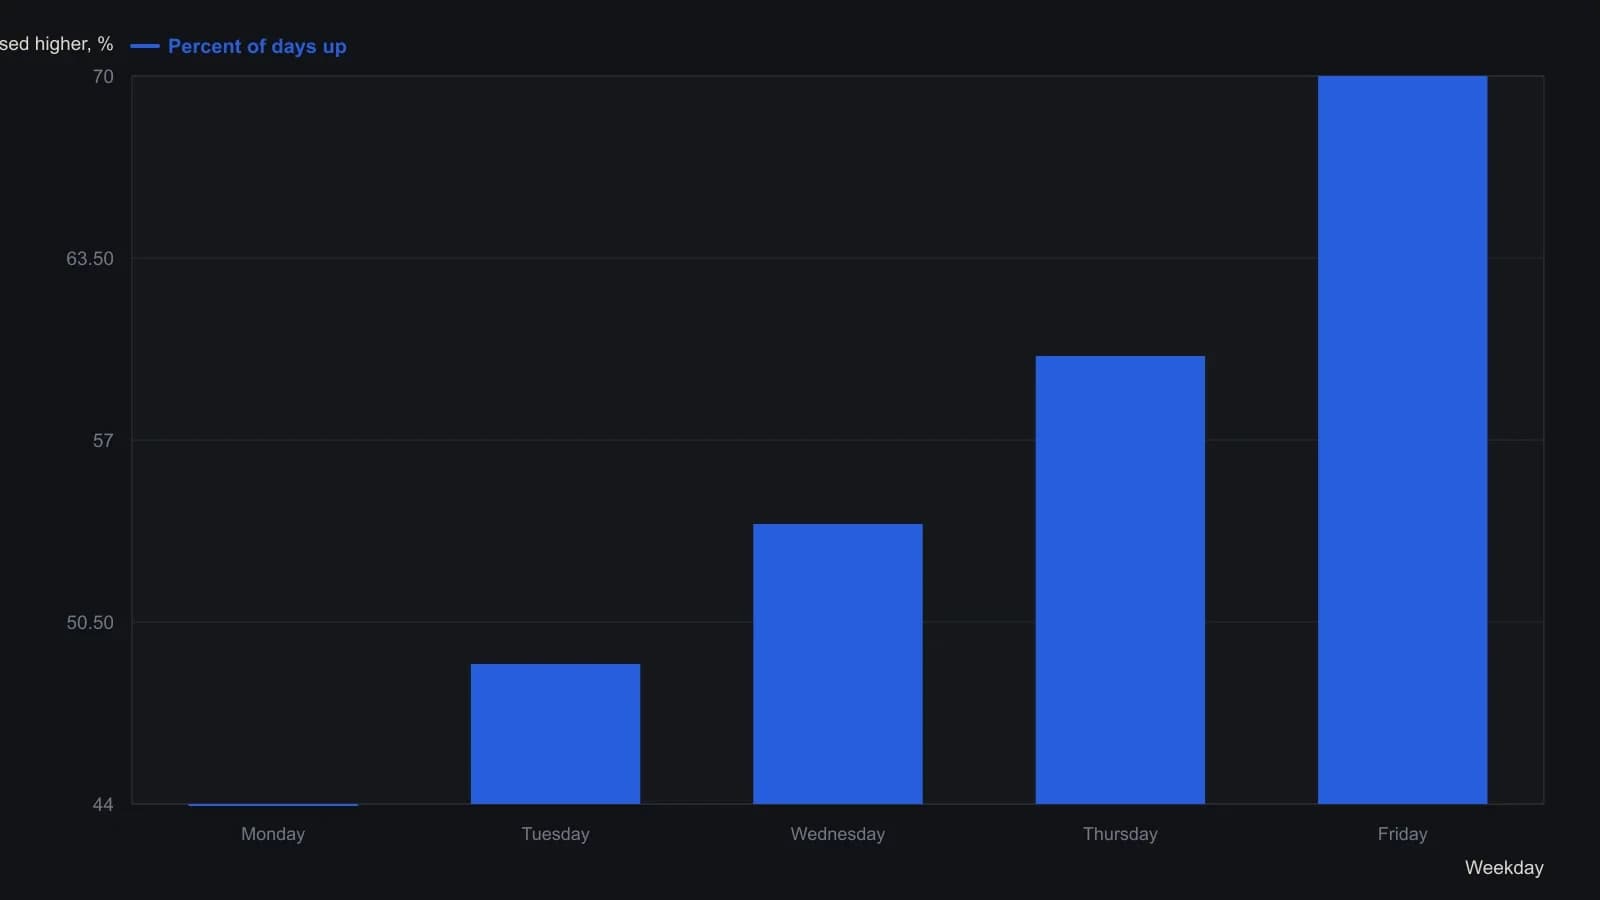
Lengths are approximate readings against the printed 0–90 scale. The paired total-decline panel uses a different unit and is not mixed into this series.
When a weekday path changed slope
Wednesday's path rose until the beginning of 1988 and then flattened even though the general market continued higher. Thursday showed the sharpest slope change: a strong upward path until around the 1987 crash, then a downward path that later flattened or began to turn up.
Weekday gain, loss, and flat tendencies were present. When those tendencies changed they appeared to shift in a regular, mutually dependent way. A regime break is a change in a weekday path's slope after a market-wide shock, or a later flattening against a still-rising broad market.
Editorial: a calendar filter needs a second gate
Editorial reading: weekday seasonality is a two-gate procedure. The first gate is a calendar filter, a rule that admits, exits, or withholds a trade solely because of the weekday of the bar. The second gate is a regime gate, which allows that calendar filter to fire only while the weekday path remains in the same slope state as the recent sample.
Editorial: a calendar filter is incomplete unless it also specifies when the same weekday must be ignored. After a regime break, the weekday is still on the calendar, and the procedure withholds it.
All readings on this track · 16 readings
- 1989Weekday price paths are regime-dependent
- 1990The January barometer as a rest-of-year scoring problem
- 1990Calendar windows as testable index-futures procedures
- 1991Testing the July-August summer rally as an occurrence count
- 1996Nested calendar clocks in long-bond futures
- 2006Stacking one-session calendar filters on index regimes
- 2008The January effect as a short window versus the month
- 2012A seasonal window still needs regime and chart confirmation
- 2013Calendar seasonality as a regime filter, not a standalone signal
- 2016A monthly seasonal heatmap as a three-gate regime filter
- 2016Payroll windows and settlement regimes
- 2017Memorial Day seasonal windows across equity, rates, and euro
- 2018Month-turn window, posture, and an open menu
- 2019Monthly FX regimes as three-state stances
- 2019Seasonal windows inside renewable cost regimes
- 2020When a breakdown fails by one box, treat it as a regime filter