1990issue C071-6
Calendar windows as testable index-futures procedures
Holiday and month-end seasonal tendencies were written as long-only index-futures procedures with named entry closes, exit closes, and stay-flat time. Those short holds sit against a large-cap versus broader-average spread so the window is judged as portfolio context.
- Seasonal tendencies were grouped into six calendar classes, but only the holiday window and the month-end window were written as concrete index-futures procedures.
- Each procedure named the entry close, the exit close, and the stay-flat interval, so entry, exit, and abstention can be tested as one unit.
- The historical workflow used an index-futures proxy, stated costs, an idle-cash credit, and a 24 percent time-exposure share, while noting leverage drift as the index level rose.
- A large-cap versus broader-average spread favored large-caps through 1989 and typically reversed toward the broader average in late December and January, the January relative-strength interval.
Six classes, two procedures
The source grouped seasonal tendencies into six classes: weekday, calendar month, month-end, holiday, presidential cycle, and year-end tax selling linked to a January relative-strength pattern.
Holiday and month-end windows were the two calendar families treated as concrete index-futures procedures.
The holiday window
The holiday window specified a long entry on the close two sessions before a holiday and an exit on the close immediately before the holiday, except that Thanksgiving and Christmas exited on the close of the session after the holiday.
The holiday review covered 38 years of pre-holiday sessions, dated the mid-February presidential holiday only from 1969, and treated the 1982 start of stock-index futures as a separate continuation check.
The month-end window
The month-end window specified a long entry on the close of the session before the month's last trading day, a five-session hold, and an exit on the close of the fourth trading day of the new month.
The month-end window was described as keeping the account invested 60 days each year out of 255 trading days, framed as 24 percent time exposure.
Proxy, costs, and leverage drift
The historical test used a listed stock-index futures contract as the index-futures proxy, citing liquidity, rather than an unweighted cash average.
The month-end simulation assumed a 25000 starting balance each year, 100 per trade for costs, and a 7.5 percent idle-cash credit on 20000 of idle cash, equal to 1500 per year.
On the simulated 25000 account, leverage drift was described as rising from about 1.3 when the composite stood at 65 to near 4-to-1 when it stood at 195.50 at the end of 1989.
January relative strength as market context
A large-cap versus broader-average spread was described as favoring large-caps through 1989, typically reversing toward the broader average in late December and January, with a two-week early-January 1990 reversal before large-caps reasserted.
Month-end NY Composite futures points by year
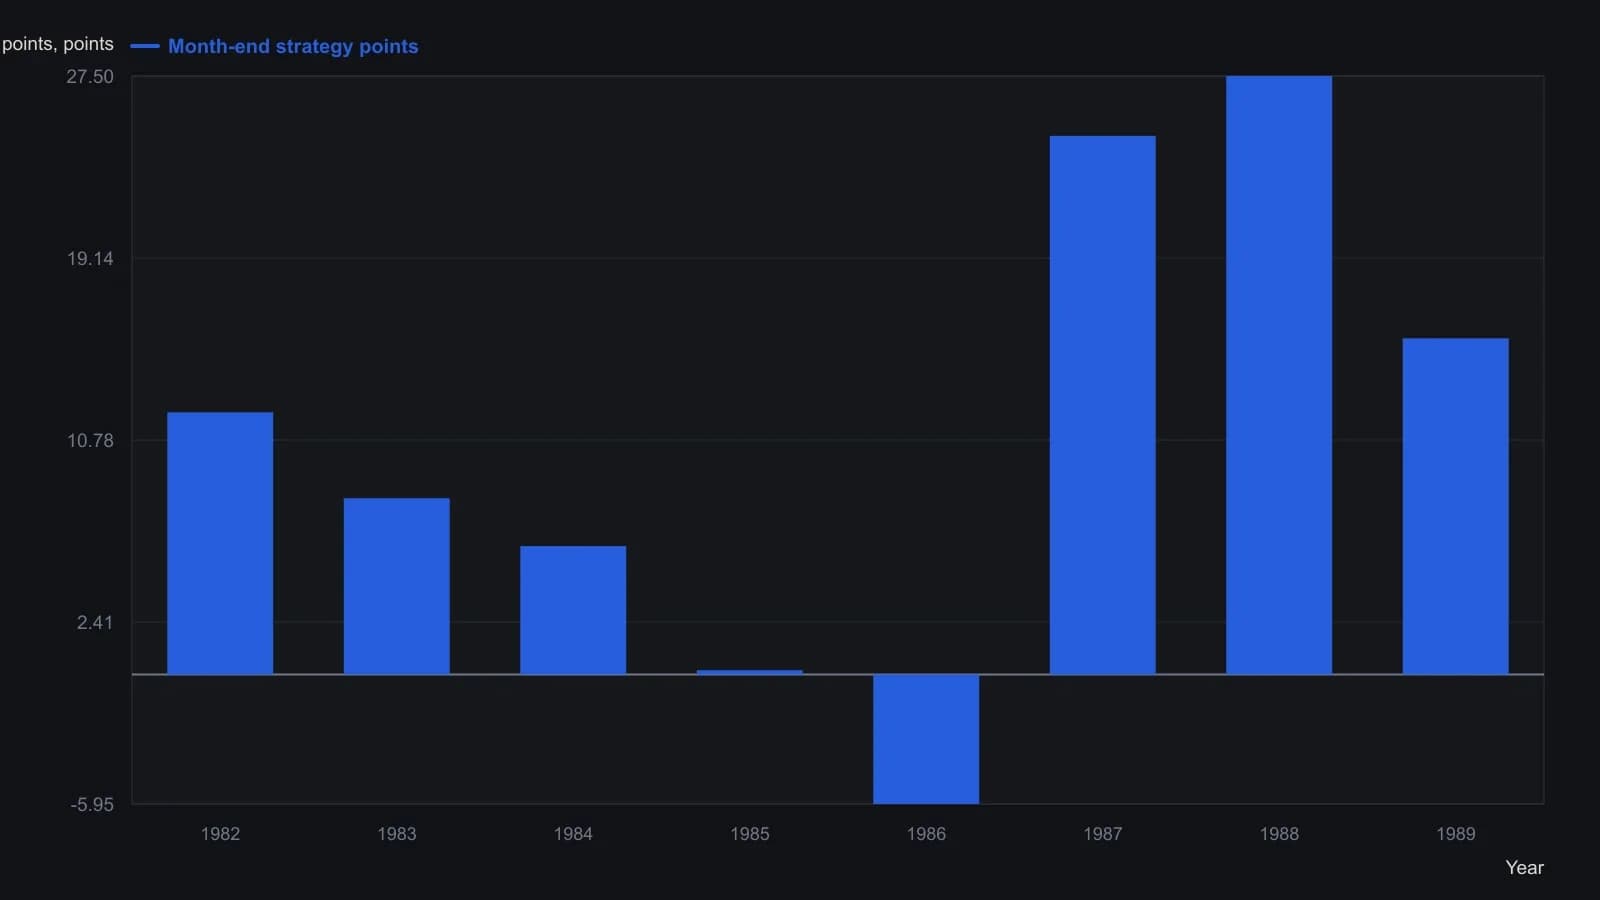
Simulation used NY Composite futures, $100 per trade for slippage and commissions, a $25,000 starting balance each year, and 7.5% interest on $20,000. The 1982 row begins in May.
All readings on this track · 16 readings
- 1989Weekday price paths are regime-dependent
- 1990The January barometer as a rest-of-year scoring problem
- 1990Calendar windows as testable index-futures procedures
- 1991Testing the July-August summer rally as an occurrence count
- 1996Nested calendar clocks in long-bond futures
- 2006Stacking one-session calendar filters on index regimes
- 2008The January effect as a short window versus the month
- 2012A seasonal window still needs regime and chart confirmation
- 2013Calendar seasonality as a regime filter, not a standalone signal
- 2016A monthly seasonal heatmap as a three-gate regime filter
- 2016Payroll windows and settlement regimes
- 2017Memorial Day seasonal windows across equity, rates, and euro
- 2018Month-turn window, posture, and an open menu
- 2019Monthly FX regimes as three-state stances
- 2019Seasonal windows inside renewable cost regimes
- 2020When a breakdown fails by one box, treat it as a regime filter