1992issue C111-10
Constructing a banded weighted open-TRIN oscillator
A four-input open-TRIN series is formed by averaging market-breadth components first, inverted onto its own ten-day two-standard-deviation rails, and then passed through a five-day weighted moving average so the finished object is a specified 0-100 oscillator.
- Averaging advancing issues, declining issues, up volume, and down volume first, then forming the ratio, is the construction used so isolated extreme sessions pull less on the open-TRIN series.
- TRIN10 can sit below 1.00 for weeks in an advance and above 1.00 through an extended decline, so a fixed 1.00 crossing does not have the same reading in both market phases.
- Ten-day two-standard-deviation bands become scaling rails: the lower band maps to 100, the upper band maps to 0, and a five-day weighted moving average of that inverted series is WTRIN10.
- The ten-day window and the five-day smoother were presented as untested defaults rather than as fitted lengths.
A daily ratio that extreme sessions can dominate
A daily four-input breadth ratio is formed from advancing issues, declining issues, up volume, and down volume. Its theoretical midpoint is 1.00. Sharp down sessions can push the daily reading above 2.4 and then dominate ordinary averages of that daily series.
Average the four inputs first
Averaging the four market-breadth inputs first, then forming the ratio, is the construction used to limit the pull of isolated extreme sessions. Market breadth here means those four ordered inputs: advancing issues, declining issues, advancing volume, and declining volume. The open-TRIN is the breadth ratio computed from moving averages of those inputs instead of from a single session's counts. The ten-day version of that series is TRIN10.
In the spreadsheet construction, TRIN10 is the ten-day average of advances over the ten-day average of declines, divided by the ten-day average of up volume over the ten-day average of down volume.
A 1.00 crossing that does not travel with the phase
Because advancing names tend to carry more volume than declining names, the ten-day open ratio sat near a 0.89 mean from July 1988 through the following four years, below the theoretical 1.00 midpoint. After component averaging, the series can remain well below 1.00 for weeks during an advance and remain above 1.00 through extended declines, so a fixed 1.00 crossing does not have the same reading in both market phases.
Invert the series onto its own rails
Ten-day, two-standard-deviation bands are placed around TRIN10. Those Bollinger bands are a ten-day envelope set two population standard deviations above and below the ten-day mean of TRIN10, used as scaling rails rather than as a price overlay. Band width uses the population standard deviation of those TRIN10 values, not of their ten-day mean.
The daily reading is then inverted and scaled so the lower band maps to 100 and the upper band maps to 0. That normalized TRIN10 may leave the 0-100 range when TRIN10 is outside the envelope.
A five-day weighted smoother
A five-day linearly weighted average of that scaled series defines WTRIN10. The weighted moving average places weights 5, 4, 3, 2, and 1 on the latest five values and divides by 15. WTRIN10 is that five-day weighted average of normalized TRIN10, plotted as the finished bounded oscillator.
How the finished oscillator was treated
The plotted WTRIN10 series was treated as a 0-100 oscillator with a rule that entered after an uptick from below 20 and exited after a downtick from above 80. The same plots show stretches when the oscillator held mid-range while price stalled, exited after the first hesitation, or stayed out of a later advance.
Default windows rather than fitted lengths
The ten-day window used for both the open-ratio average and the bands, and the five-day weighted smoother, were presented as untested defaults rather than as fitted lengths.
WTRIN10 oscillator versus its 20 and 80 rails, November 1991–June 1992
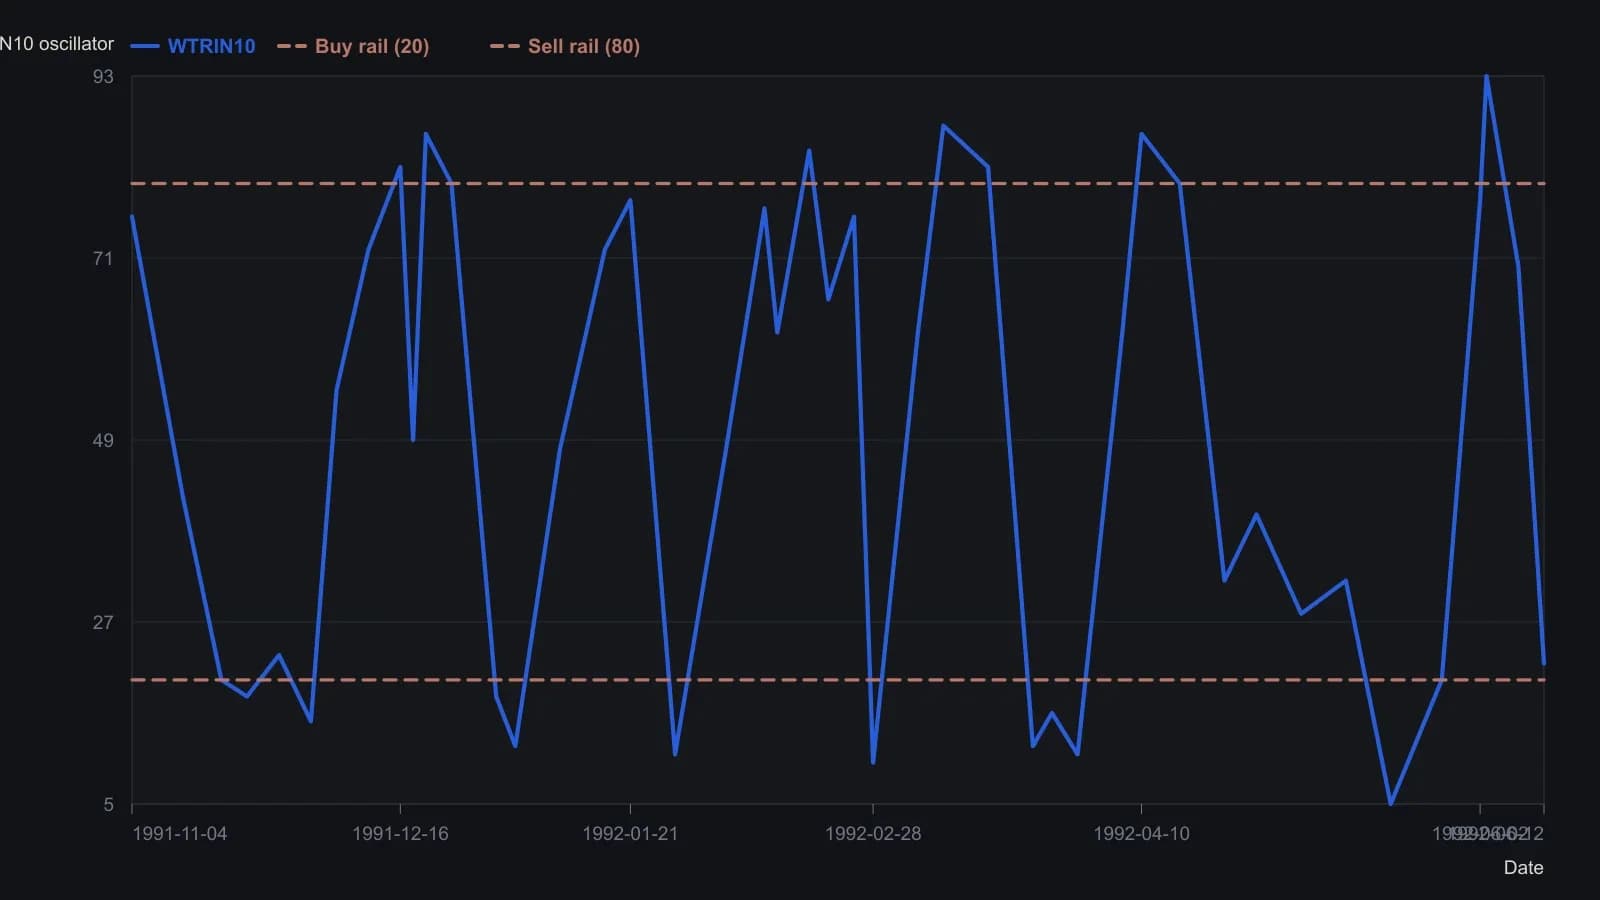
WTRIN10 is the five-day weighted average of 10-day open TRIN after that series is inverted onto its own 10-day, two-standard-deviation bands (lower band maps to 100, upper band to 0). Dates are taken from the month grid on the print; y-values are approximate raster readings, not tabulated prints.
All readings on this track · 20 readings
- 1988Indicator smoothing: lookback, weight, and scale
- 1990Recency weighting in simple, linear, and exponential moving averages
- 1990Seed and recurrence construction for moving averages
- 1990Constructing a five-day step-weighted moving average
- 1992Constructing simple, weighted, and exponential moving averages
- 1992Constructing moving averages with weighting schemes and extra filters
- 1992Constructing a weighted-average TRIN10 with Bollinger envelopes
- 1992Constructing a banded weighted open-TRIN oscillator
- 1993Evaluating a weighted dual rate-of-change momentum filter
- 1993Constructing equal, linear and exponential moving averages
- 1993Constructing a general weighted moving average from one exponent
- 1993Calibrating the weighted-moving-average exponent
- 1993Constructing an exponent-weighted average of put-call ratios
- 1994Cycle-tuned momentum with spectral peaks
- 1999How a five-bar sine-weighted average is assembled
- 2003Same-scale trend filter from a rolling least-squares endpoint
- 2003How a rolling linear-regression endpoint is assembled as a moving-trend
- 2004Constructing a volume-weighted moving average as a forecast baseline
- 2005Constructing a move, volume and recency weighted average
- 2016MACD as a zero-line filter with dual moving averages