1993issue C051-7
Score one swing with volume, bands, and price divergence
The same swing can be scored with an up-down volume oscillator, a band envelope around a volume line, and a divergence check against price. Those three readings make participation a testable companion to the tape rather than a decorative lower pane.
- Reduce daily total volume to a short moving-average baseline, called normal volume, and compare later volume with price as a confirmation or nonconfirmation check.
- Build an up-down volume oscillator from the spread between advancing and declining volume, then compare that spread across a defined lookback so participation can be read as expanding or fading.
- Place Bollinger Bands around a signed volume line to mark when participation stretches away from its recent baseline while price still climbs or falls.
- Treat a new price swing that the volume series or volume line fails to confirm as a divergence, a mismatch that can be tested rather than assumed.
Score the same swing three ways
Daily total volume, a signed volume line, and an up-down volume oscillator can be read against the same price swing. The oscillator is a momentum-style series built from the spread between advancing and declining volume, then compared across a defined lookback so breadth participation can be read as expanding or fading.
Bollinger Bands form a two-standard-deviation envelope around a moving average of that volume-derived line. They mark when participation stretches away from its recent baseline. Divergence is the remaining check: price makes a new swing while a volume or breadth series fails to confirm it.
Start from normal volume
Daily total volume can be reduced to a 10-session moving-average baseline. That short average is the normal volume against which later volume can be judged as expanded or contracted, then compared with price as a confirmation or nonconfirmation check.
Relative to that volume baseline, a breakout from a small congestion range was associated with about a 20 percent volume increase. A sharp selloff was associated with about a 40 percent increase.
Sign a volume line from the close
A volume line is a cumulative total that adds or subtracts session volume according to a signing rule. Session volume is added when the close is above the high-low midpoint and subtracted when the close is below. The result is a participation path that can be compared with price.
IBM 10-day normal volume, October 1990 to April 1991
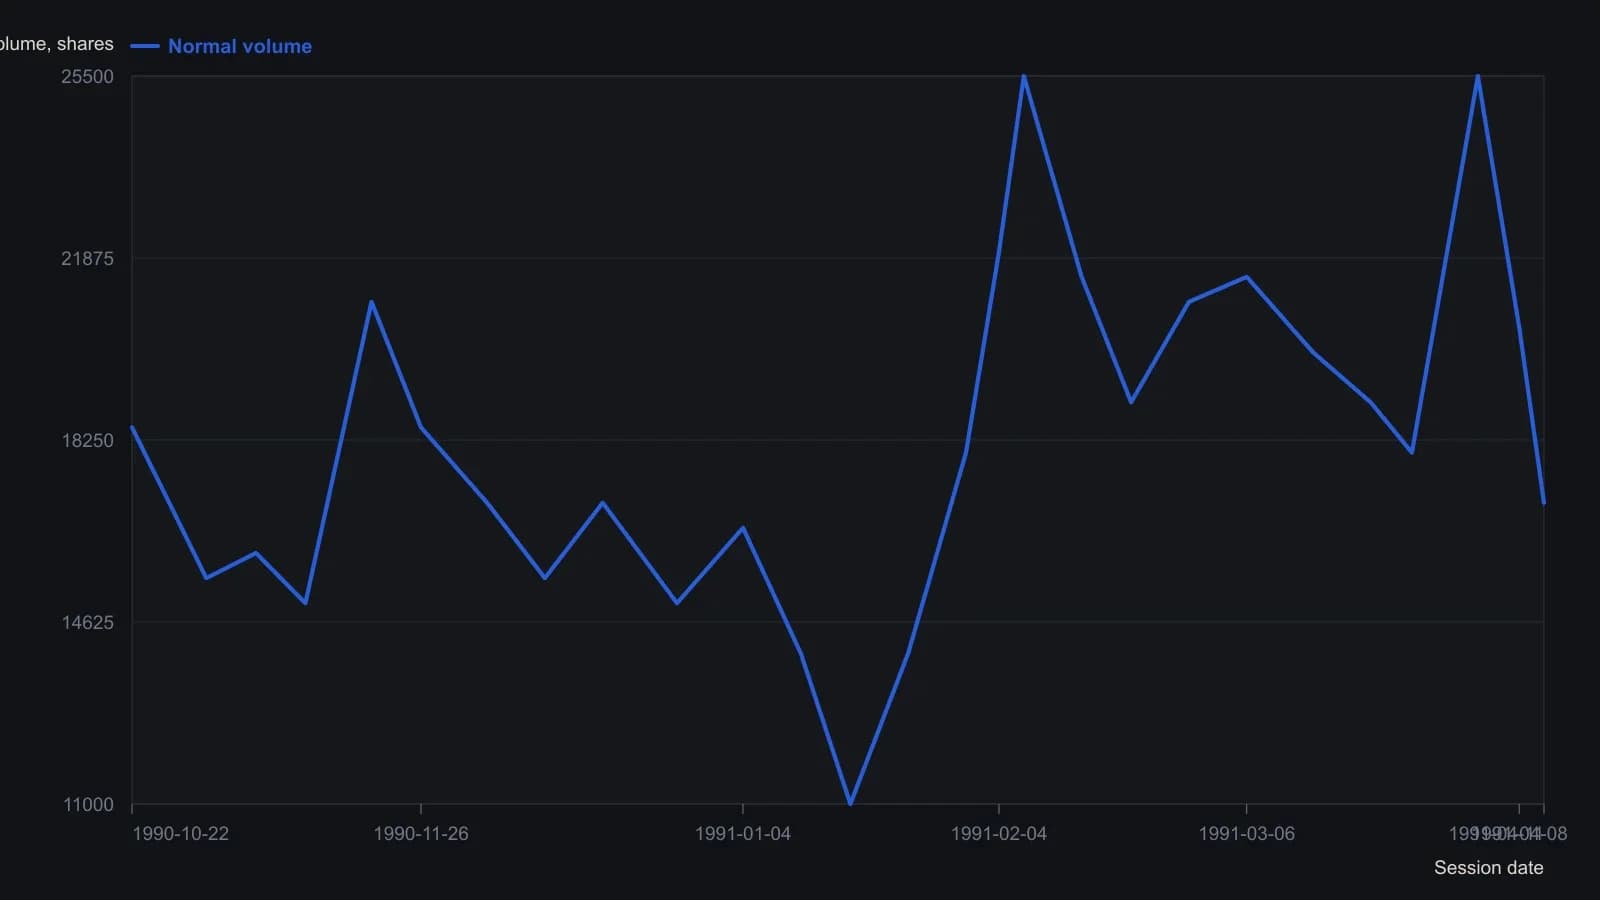
Star follows Waxenberg: normal volume is a 10-day average of daily share volume. A five-period average of the close is used only to judge price direction and is not in this series. Peaks C and F slightly overshoot the printed 25,000 line.
Read the up-down volume oscillator
An up-down volume oscillator is built by subtracting declining volume from advancing volume and then taking a 10-session average of that spread versus the same spread from 12 sessions earlier.
On the illustrated exchange series, readings near +25 million shares were treated as momentum-peak territory and readings near -20 million shares as oversold-type territory, while some oscillator highs printed nearer +50 million and some price bottoms aligned with the -50 million area.
The same up-down volume oscillator can be plotted against other index or futures price bars to compare broad-market participation with a narrower price series.
Mark the volume line with bands
Bollinger Bands set two standard deviations from a 20-session average of a cumulative volume line. They mark when that line holds above the average after an upper-band break, or slips below the average while price continues to climb or fall.
Test the swing for divergence
Illustrated divergences include a volume series rolling over while price holds or rises, a volume spike unmatched by a new price high, and a price low unmatched by a new volume-line low. Each mismatch turns the chart condition into a testable hypothesis.
Compare volume momentum with price momentum
The same momentum formula can be applied to the up-down volume spread and to daily price so peaks in volume momentum and price momentum can be compared on one chart.
Read the three scores together
Editorial: begin with normal volume versus price, then read the up-down volume oscillator, then see whether the volume line is holding above or slipping below its band average, and finally ask whether price and participation diverge. The archive supplies the workflow. The three-way score is the editorial habit.
All readings on this track · 6 readings
- 1990Evaluating a weekly up-volume ratio and an hourly oscillator
- 1993Score one swing with volume, bands, and price divergence
- 1993Constructing smoothed stochastics and an up/down volume oscillator
- 2001Constructing volume breadth with a negative volume index and up/down ratios
- 2005Constructing a signed, bounded market-breadth panel
- 2013Constructing an up/down volume oscillator from a web price series