2014issue C1312-18
Construct a trough-to-trough cycle map with the Detrended Price Oscillator
The Detrended Price Oscillator is built as close minus a moving average taken (n/2)+1 periods earlier so trend is stripped and the cycle remains. Length is then marked trough to trough, and named deviations show whether that timeline is shortening, lengthening, or flattening.
- Measure cycle length trough to trough, not peak to peak, because troughs are treated as more stable anchors.
- Build the Detrended Price Oscillator as close minus the moving average from (n/2)+1 periods earlier to strip trend and leave the cycle.
- Use extreme, extended, failed, and reverberating peaks or troughs to read whether the cycle timeline is shortening, lengthening, or flattening.
- Treat the construction as useful in moderately trending or velocity conditions, and not as useful when price is sideways.
Editorial frame
TradersWeek editorial aim: build a trough-to-trough cycle map from the Detrended Price Oscillator so timeline shifts can be classified before price completes a top or bottom. The archive facts below describe that historical construction workflow.
Strip the trend, keep the cycle
The Detrended Price Oscillator is constructed by subtracting a displaced moving average. The specified form is close minus the moving average from (n/2)+1 periods earlier. The subtraction is used to strip trend and leave the cycle.
Anchor the map at troughs
Cycle length is measured trough to trough rather than peak to peak because troughs are treated as more stable anchors than peaks.
Name the deviations
Named cycle deviations are the vocabulary for reading whether the cycle timeline is shortening, lengthening, or flattening. That vocabulary includes extreme and extended peaks or troughs, failed peaks or troughs, and reverberating cycles.
Weekly Dow Jones Industrial Average
An eight-period weekly setting on the Dow Jones Industrial Average is used to show failed peaks and lower troughs forming before a top begins. On the same weekly series, an extreme trough precedes the 2008 final low, a failed peak flags 2009 cycle weakness, and a higher trough is treated as the 2009 absolute low. After that extreme trough the weekly Dow cycle is described as reverberating, with no true peak or trough from July 2009 to April 2010.
Nasdaq Composite and General Electric
A weekly eight-period setting on the Nasdaq Composite is used the same way. Failed peaks and lower troughs mark topping, and a 2008 extreme trough precedes the 2009 final low. A five-period setting on General Electric shows an extended trough before the October bottom, a November reverberation, then a resumed trough-to-peak cycle.
Conditions that fit the construction
The construction is presented as useful in moderately trending or velocity conditions and not as useful when price is sideways, because the oscillator is meant to expose the cycle inside a trend.
Eight-period Detrended Price Oscillator on weekly DJIA
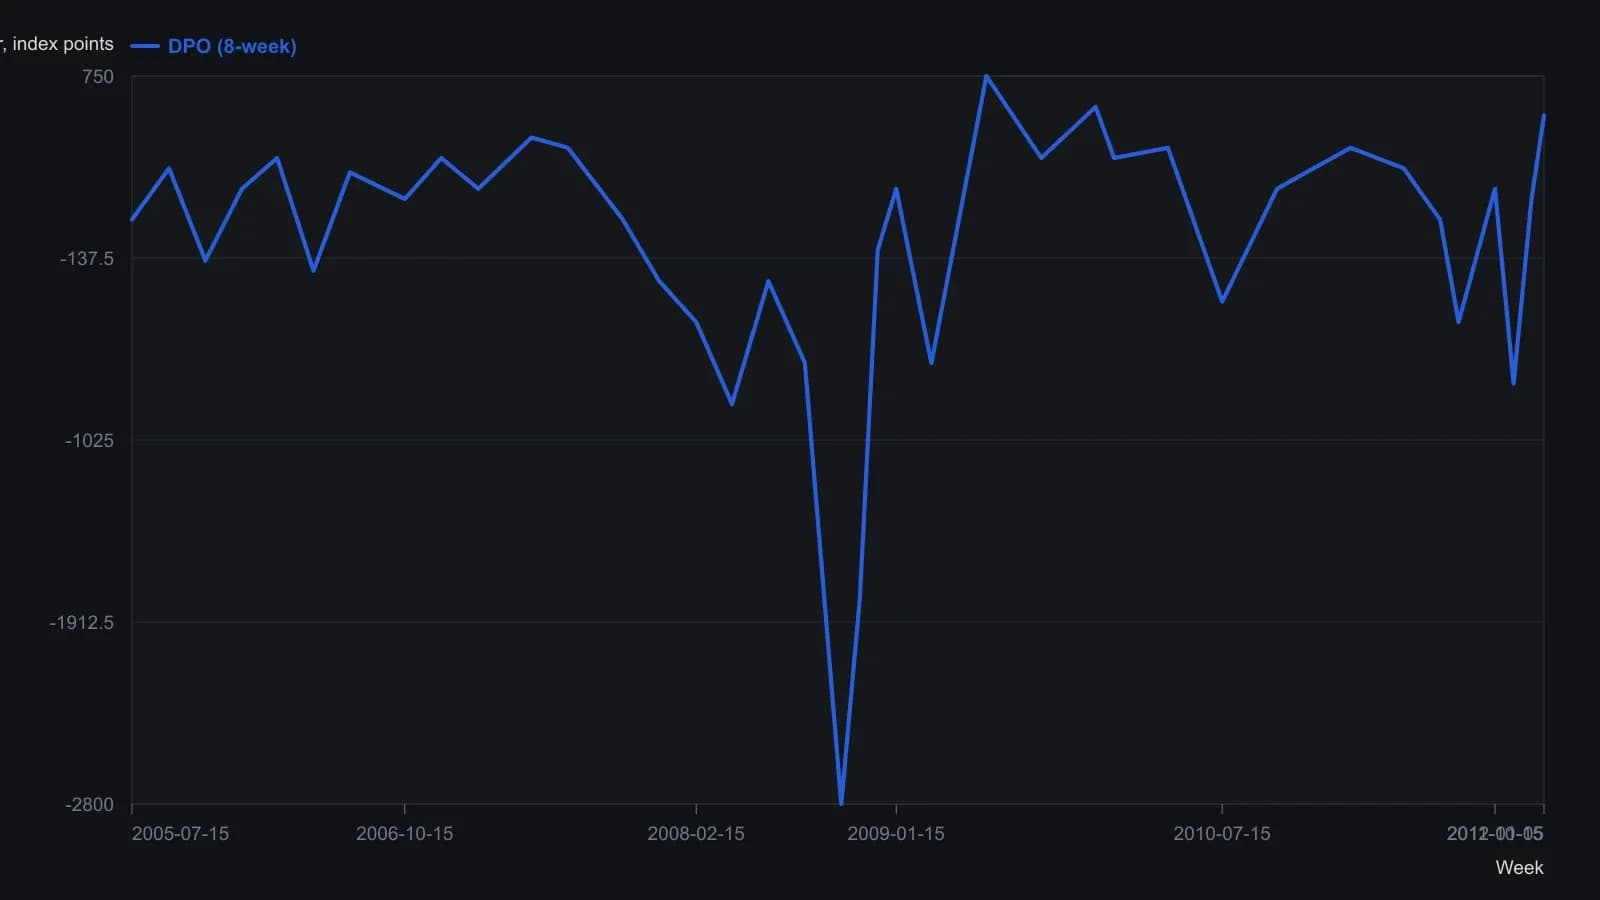
Source fixes oscillator length at eight weeks and measures cycle length trough to trough, never peak to peak. Digitized points are approximate to the nearest 50–100 index points except the boxed last value.
All readings on this track · 31 readings
- 1982Cycle phase windows for chart signal filters
- 1987Constructing a cycle-scaled trend oscillator
- 1987Constructing a dominant-cycle grid from marked lows
- 1988Cycle lead from staggered exponential averages
- 1988Auditing the forty-month stock-price cycle
- 1989When long-wave dominant cycles cannot be disproved
- 1991Half-cycle average plot shift versus cycle attenuation
- 1991Half-cycle average contact as an amplitude-ratio test
- 1993Building a restoring-pull indicator from cycle frequency and volume
- 1995Regime filters for a dominant long wave
- 1995A cycle-tuned lead filter from bounded oscillators
- 1998Testable cycle rules instead of fear and greed
- 1999Nested Euro cycle timing as one checkable procedure
- 2002Constructing an instantaneous trendline from a dominant cycle
- 2002Half-cycle center of gravity oscillator from moving-average balance
- 2004Testing a locked forty-week cycle with a hold-or-sit-out rule
- 2005Nested timing bands for dominant-cycle confirmation
- 2005Dominant-cycle baselines versus policy-news narratives
- 2006Pairing a dominant-cycle horizon with trend and oscillators
- 2006A dominant-cycle split into a trend filter and residual Relative Strength Index
- 2007Construct a momentum difference from the dominant cycle
- 2007Naive dominant-cycle rules fail without crowd tests
- 2012Constructing a dominant-cycle forecast as a timing window
- 2012Open-parameter construction of dominant-cycle baselines
- 2013Using a second-term election to check a predeclared dominant-cycle forecast
- 2014Constructing a dominant-cycle forecast baseline
- 2014Quotient transform as an early-onset trend filter
- 2014Construct a trough-to-trough cycle map with the Detrended Price Oscillator
- 2015Dominant-cycle alignment before an earnings catalyst
- 2017Causal reverse exponential average for cycle and trend
- 2020Constructing a cycle-plus-trend oscillator from a one-wavelength chord