1987issue C111-4
Constructing a dominant-cycle grid from marked lows
A dominant-cycle search can be built by hand. Mark significant lows, lock a cycle-grid with even spacing, keep only alignments that pass an equal-row-test, and convert the accepted spans into an average-cycle-length that can be projected and later checked.
- Many calculated cycle procedures cannot confirm that a cycle low occurred on the current day because delay is built into the calculations.
- A search can begin by marking significant-turning-point lows on an ordered price series, usually after a 0.5% reversal from the prior high.
- A candidate is accepted only when a straightedge aligns cycle-grid dots that pass the equal-row-test, with the same number of rows between them.
- Average-cycle-length is a calendar-day figure used to project later dates, with extra attention at cycle-convergence.
Start from marked lows, not delayed calculations
Many calculated cycle procedures cannot confirm that a cycle low occurred on the current day because delay is built into the calculations. A dominant-cycle search can begin by marking significant lows on an ordered price series and testing those dates on a fixed overlay.
XMI closes with marked significant lows
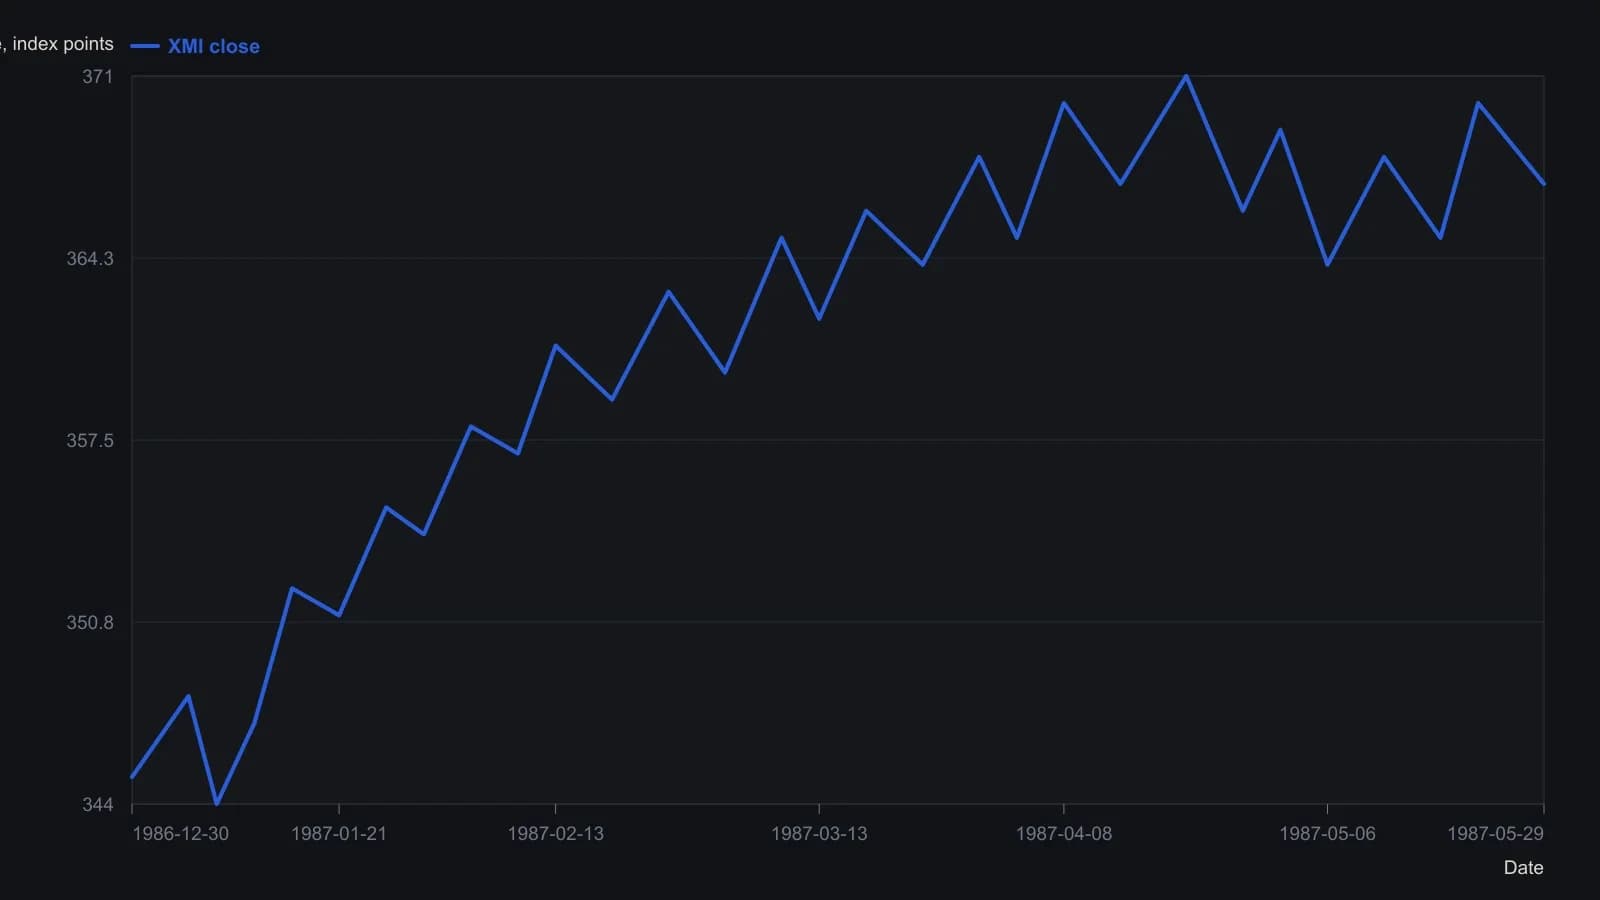
Raster is a mirrored scan of the magazine figure; time was restored left-to-right and prices were read from the printed 333–373 scale. Bottoms were those Hannula marked as moving at least 0.5% from the prior high, except the 12 January low he kept by eye. Y values are approximate to about one index point.
Mark significant turning points
A significant-turning-point is a low or high retained as a cycle event, usually after a minimum percentage reversal from the prior opposite extreme. The usual selection rule marks a low after a 0.5% reversal from the prior high, with rare visual exceptions.
The illustration used closes only. Routine construction preferred high/low/close bars, lows for indexes and stocks, and highs for commodities. Highs, lows, or both remain valid inputs.
Build the cycle-grid
The next construction step places evenly spaced dots in a vertical column through each marked low date so the dots also form horizontal rows on a transparent overlay. That overlay is the cycle-grid: a dotted overlay whose columns sit on marked turning-point dates and whose evenly spaced dots also form horizontal rows.
Apply the equal-row-test
A candidate cycle is accepted only when a straightedge can align dots that are separated by the same number of rows. The equal-row-test is that rule: dots on a candidate slope count as a cycle only when they are the same number of grid rows apart.
Read concurrent cycles from one grid
In the five-month index example, one alignment used five dots two rows apart and a steeper alignment used seven dots also two rows apart. Those two alignments were treated as two concurrent cycles.
Convert accepted spans to average-cycle-length
Average-cycle-length is the calendar-day span between the first and last accepted lows divided by the number of completed cycles, then used to project later dates. Four cycles in 139 days averaged 34.750 days, and six cycles in 127 days averaged 21.167 days.
Cycle length is specified in calendar days rather than trading days so the lookback continues through non-trading periods. Calendar-day-sampling measures cycle length across every calendar day rather than only sessions when the market is open.
Project the averages and watch cycle-convergence
Those average lengths are meant to be projected forward. Extra attention is given when two or more projected cycles meet at the same time. That meeting is a cycle-convergence: a date at which two or more projected cycle lows meet and therefore receive extra scrutiny.
All readings on this track · 31 readings
- 1982Cycle phase windows for chart signal filters
- 1987Constructing a cycle-scaled trend oscillator
- 1987Constructing a dominant-cycle grid from marked lows
- 1988Cycle lead from staggered exponential averages
- 1988Auditing the forty-month stock-price cycle
- 1989When long-wave dominant cycles cannot be disproved
- 1991Half-cycle average plot shift versus cycle attenuation
- 1991Half-cycle average contact as an amplitude-ratio test
- 1993Building a restoring-pull indicator from cycle frequency and volume
- 1995Regime filters for a dominant long wave
- 1995A cycle-tuned lead filter from bounded oscillators
- 1998Testable cycle rules instead of fear and greed
- 1999Nested Euro cycle timing as one checkable procedure
- 2002Constructing an instantaneous trendline from a dominant cycle
- 2002Half-cycle center of gravity oscillator from moving-average balance
- 2004Testing a locked forty-week cycle with a hold-or-sit-out rule
- 2005Nested timing bands for dominant-cycle confirmation
- 2005Dominant-cycle baselines versus policy-news narratives
- 2006Pairing a dominant-cycle horizon with trend and oscillators
- 2006A dominant-cycle split into a trend filter and residual Relative Strength Index
- 2007Construct a momentum difference from the dominant cycle
- 2007Naive dominant-cycle rules fail without crowd tests
- 2012Constructing a dominant-cycle forecast as a timing window
- 2012Open-parameter construction of dominant-cycle baselines
- 2013Using a second-term election to check a predeclared dominant-cycle forecast
- 2014Constructing a dominant-cycle forecast baseline
- 2014Quotient transform as an early-onset trend filter
- 2014Construct a trough-to-trough cycle map with the Detrended Price Oscillator
- 2015Dominant-cycle alignment before an earnings catalyst
- 2017Causal reverse exponential average for cycle and trend
- 2020Constructing a cycle-plus-trend oscillator from a one-wavelength chord