1991issue C051-5
Half-cycle average contact as an amplitude-ratio test
A half-cycle average meets price at a swing extreme only under a special amplitude-to-trend ratio. Treat skim-contact as a coincidence test, then attribute any remaining miss to plot-shift, averaging-attenuation, or session-range-scatter before locking a lookback into a rule-based entry.
- In an idealized sine-plus-trend path, a half-cycle average equals price at the cycle extrema only when cycle amplitude matches the secular-trend increment over one-quarter of the period.
- The same construction keeps the average from crossing to the far side of price near a full-cycle secular-trend increment divided by 4.74, but those ratios are model limits, not market constants.
- Most average contacts are attributed to session-range-scatter rather than a stable cycle, because persistent cyclical structure is treated as uncommon.
- Plot-shift, averaging-attenuation, session volatility, and cyclic content jointly control entry location, and choosing length from a full-cycle estimate down toward a half-cycle length is ranked as the primary adjustment before a rule-based entry.
Skim-contact is not a general property
A half-cycle average is a simple moving average whose lookback is set to half of a stated dominant-cycle estimate. Skim-contact is a meeting of price and that short average at a trend extreme. The archive treats that meeting as something that can occur only under a special trend-versus-amplitude ratio, not as a general property of the average.
An idealized amplitude-to-trend limit
In an idealized path that adds a linear trend to a sine of period T, a half-cycle average equals price at the cycle extrema only when cycle amplitude equals the secular-trend increment over one-quarter of T.
In that same construction, the amplitude that keeps the half-cycle average from crossing to the far side of price sits near the full-cycle secular-trend increment divided by 4.74.
Lag and averaging-attenuation without trend
With the trend term removed, the half-cycle average of a sine is another sine scaled by the constant 2/π, and the conventionally plotted average lags the wave by a quarter cycle. Averaging-attenuation is that reduction in cycle amplitude, even when the wave remains sinusoidal.
Those exact ratios are framed as limits of a perfect sine-plus-trend model, not as quantities that market prices are expected to hold.
Critical amplitude-to-trend ratio for half-cycle skim contact
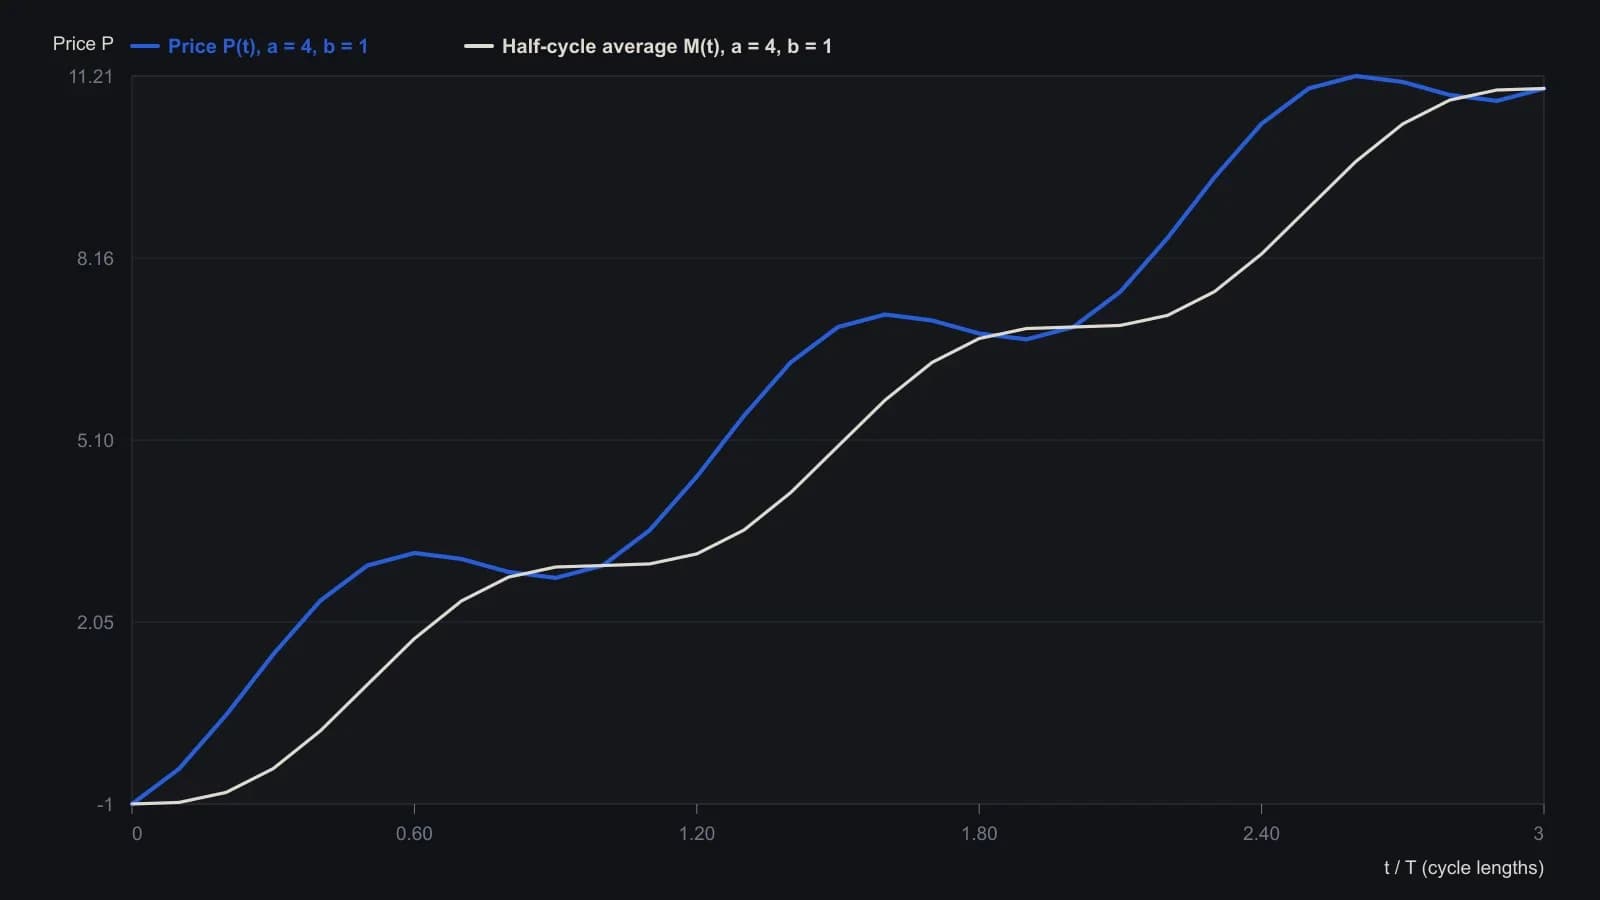
Contact is exact only for a pure sine plus linear drift. Newcombe warns these numbers should not be read literally in market prices. He also gives a nearby bound, b ≈ a/4.74, where the average stays at or below price.
Session-range-scatter and uncommon cycles
A follow-up note accepts the amplitude-to-trend condition and adds that session-range-scatter around any cycle also decides whether price reaches the average.
Persistent cyclical structure is treated as uncommon, with an estimate of less than 20 percent of the time, so most average contacts are attributed to varying session range rather than a stable cycle.
Plot-shift on a right-aligned average
Moving a centered average of fixed length to a conventional right-aligned plot opens a vertical gap. That gap is plot-shift, and it is further altered by averaging-attenuation.
On one illustrated currency series, a 12-day average leaves a detrended gap that appears to vary with a cycle, while a 6-day half-cycle average narrows the gap and is shown as placing candidate entries closer to price.
Lookback as the primary adjustment
After listing plot-shift, averaging-attenuation, session volatility, and cyclic content as joint controls on entry location, the archive ranks choosing average length, from a full-cycle estimate down toward a half-cycle length, as the primary adjustment. Dominant-cycle length is the working period estimate used to choose a full-cycle lookback and its half-cycle counterpart.
A rule-based entry is then a testable procedure that fires only when price and the chosen average meet under stated trend, cycle, and range conditions.
All readings on this track · 31 readings
- 1982Cycle phase windows for chart signal filters
- 1987Constructing a cycle-scaled trend oscillator
- 1987Constructing a dominant-cycle grid from marked lows
- 1988Cycle lead from staggered exponential averages
- 1988Auditing the forty-month stock-price cycle
- 1989When long-wave dominant cycles cannot be disproved
- 1991Half-cycle average plot shift versus cycle attenuation
- 1991Half-cycle average contact as an amplitude-ratio test
- 1993Building a restoring-pull indicator from cycle frequency and volume
- 1995Regime filters for a dominant long wave
- 1995A cycle-tuned lead filter from bounded oscillators
- 1998Testable cycle rules instead of fear and greed
- 1999Nested Euro cycle timing as one checkable procedure
- 2002Constructing an instantaneous trendline from a dominant cycle
- 2002Half-cycle center of gravity oscillator from moving-average balance
- 2004Testing a locked forty-week cycle with a hold-or-sit-out rule
- 2005Nested timing bands for dominant-cycle confirmation
- 2005Dominant-cycle baselines versus policy-news narratives
- 2006Pairing a dominant-cycle horizon with trend and oscillators
- 2006A dominant-cycle split into a trend filter and residual Relative Strength Index
- 2007Construct a momentum difference from the dominant cycle
- 2007Naive dominant-cycle rules fail without crowd tests
- 2012Constructing a dominant-cycle forecast as a timing window
- 2012Open-parameter construction of dominant-cycle baselines
- 2013Using a second-term election to check a predeclared dominant-cycle forecast
- 2014Constructing a dominant-cycle forecast baseline
- 2014Quotient transform as an early-onset trend filter
- 2014Construct a trough-to-trough cycle map with the Detrended Price Oscillator
- 2015Dominant-cycle alignment before an earnings catalyst
- 2017Causal reverse exponential average for cycle and trend
- 2020Constructing a cycle-plus-trend oscillator from a one-wavelength chord