2013issue C0414-21
Using a second-term election to check a predeclared dominant-cycle forecast
A historical case study asked why major US equity indexes sold off in the week after a reelection instead of continuing a long-wave advance already used to explain a second term. The working comparison keeps a k-wave baseline in view and treats political calendars as overlays in an out-of-sample-check.
- A long-wave rise that was already used to explain a second term can be retested in the price window after the vote.
- The explicit quantitative baseline was a k-wave chart with an S&P 500 overlay through a stated sample date, not the political story of reelection week.
- A presidential-cycle and a fed-chairmanship-cycle can be added to the same chart to test whether other calendars explain the same movement.
- Editorial: isolate dominant-cycle turning points from noisy political overlays, then compare the stated baseline with what prices did after the vote.
A cycle call already on the record
A prior cycle study had already treated a long-wave rise as the reason a sitting president would win a second term. After the reelection, the same study asked why major US equity indexes sold off the following week instead of continuing the previously forecasted advance.
That later window is the out-of-sample-check: a later price window used to test whether a cycle call made before the event still described the path after the event.
The k-wave as the stated baseline
The case study used an updated long-wave chart with an S&P 500 overlay through a stated sample date as the explicit quantitative baseline. In the terminology of this article, that chart is the k-wave.
On that overlay the index was described as following the suggested upward path, but with substantial volatility attributed to fiscal-cliff uncertainty and political conflict.
Political calendars as overlays
A presidential-cycle is a four-year political calendar used as a secondary overlay when asking whether a reelection week should have continued or interrupted a predeclared market path. The author treated the presidential-election and stock-market relationship as historically strong but not guaranteed to repeat the same way in every cycle.
A fed-chairmanship-cycle was added to the same chart to test whether that second calendar helped explain the observed market movement. The overlay is a leadership-tenure calendar on the same path, not a substitute for the long-wave baseline.
What the archive treated as predictive
After reviewing politics, changing Fed chairs under different presidents, and the presidential-cycle overlay, the author concluded that only the long-wave turning-point pattern predicted the future path.
That long-wave model was described as ignoring volatility inside a bullish or bearish trend and focusing only on the turning points.
S&P 500 across U.S. presidential terms, 1980–2012
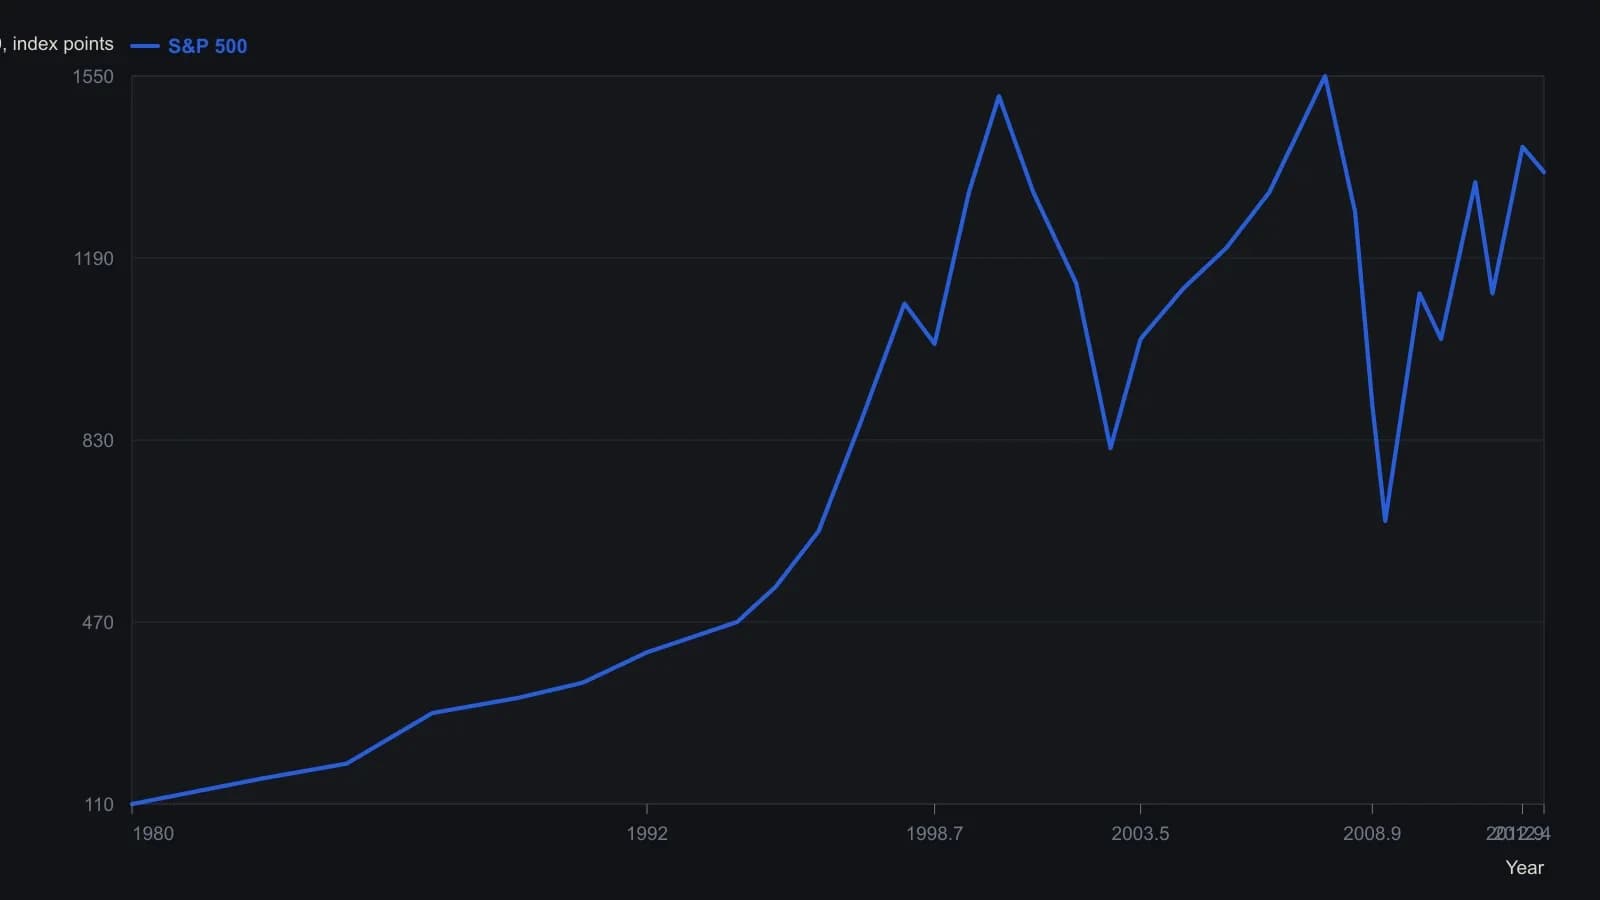
Y-scale on the print runs from 0 to 1600. Digitized closes are approximate readings against that scale, except the labeled 814.41 low and the 30 November 2012 quote. Early-1980s bars are compressed, so those points are the coarsest. The source also drew 13-, 40- and 80-period moving averages and an Elliott wave count; those overlays were not converted.
Editorial reading of the workflow
Editorial: treat a second-term election as an out-of-sample-check on a predeclared cycle forecast. Isolate the dominant-cycle turning points from noisy political overlays, keep the presidential-cycle and the fed-chairmanship-cycle as secondary calendars, and compare the stated k-wave baseline with what prices actually did after the vote.
Editorial: the archive described that historical workflow and still assigned the later path to long-wave turning points. It did not present the isolation step as a standing rule for later elections.
All readings on this track · 31 readings
- 1982Cycle phase windows for chart signal filters
- 1987Constructing a cycle-scaled trend oscillator
- 1987Constructing a dominant-cycle grid from marked lows
- 1988Cycle lead from staggered exponential averages
- 1988Auditing the forty-month stock-price cycle
- 1989When long-wave dominant cycles cannot be disproved
- 1991Half-cycle average plot shift versus cycle attenuation
- 1991Half-cycle average contact as an amplitude-ratio test
- 1993Building a restoring-pull indicator from cycle frequency and volume
- 1995Regime filters for a dominant long wave
- 1995A cycle-tuned lead filter from bounded oscillators
- 1998Testable cycle rules instead of fear and greed
- 1999Nested Euro cycle timing as one checkable procedure
- 2002Constructing an instantaneous trendline from a dominant cycle
- 2002Half-cycle center of gravity oscillator from moving-average balance
- 2004Testing a locked forty-week cycle with a hold-or-sit-out rule
- 2005Nested timing bands for dominant-cycle confirmation
- 2005Dominant-cycle baselines versus policy-news narratives
- 2006Pairing a dominant-cycle horizon with trend and oscillators
- 2006A dominant-cycle split into a trend filter and residual Relative Strength Index
- 2007Construct a momentum difference from the dominant cycle
- 2007Naive dominant-cycle rules fail without crowd tests
- 2012Constructing a dominant-cycle forecast as a timing window
- 2012Open-parameter construction of dominant-cycle baselines
- 2013Using a second-term election to check a predeclared dominant-cycle forecast
- 2014Constructing a dominant-cycle forecast baseline
- 2014Quotient transform as an early-onset trend filter
- 2014Construct a trough-to-trough cycle map with the Detrended Price Oscillator
- 2015Dominant-cycle alignment before an earnings catalyst
- 2017Causal reverse exponential average for cycle and trend
- 2020Constructing a cycle-plus-trend oscillator from a one-wavelength chord