2004issue C011-4
Testing a locked forty-week cycle with a hold-or-sit-out rule
A 40-week dominant-cycle can be evaluated as a locked calendar-clock: freeze the interval first, then judge the claim only by whether the two halves produce different results under one hold-or-sit-out procedure.
- Lock a 40-week calendar-clock before looking at prices, then treat that clock as the dominant-cycle claim under test.
- A phase-split scores the hypothesized stronger first 20 weeks against the weaker last 20 weeks on the same index series.
- A mechanical-trading-system turns the clock into one hold, exit, and sit-out procedure that can be scored as a single test.
- The author presents the phase-split as a historical tendency test, not as proof that cycles exist or that the pattern must continue.
Lock the clock first
The study locks a 40-week dominant-cycle to a calendar-clock that begins on 15 May 1970 and restarts every 280 calendar days. The rhythm is set by that start date and a fixed number of calendar days, not by peaks and troughs in price.
Once the clock is frozen, each interval can be split and scored on the same index series. The dominant-cycle claim is then judged after the sampling interval has already been fixed.
Score the two halves
Each clock is split by a phase-split. The first 20 weeks are the hypothesized stronger half and the last 20 weeks are the hypothesized weaker half, so both halves can be scored on the same index series.
The phase-spread is the difference between first-half and second-half index change inside the same cycle.
What the completed-cycle-sample showed
As of 2 May 2003 the completed-cycle-sample contains 43 such cycles. In that sample the first half posted a gain in 33 of 43 cycles and the second half posted a gain in 23 of 43 cycles.
Average first-half index change was +6.83 percent, versus +0.20 percent in the second half. The first half beat the second half of the same cycle in 28 of 43 cases.
S&P 500: $1,000 held only in each 20-week half of the locked 40-week clock
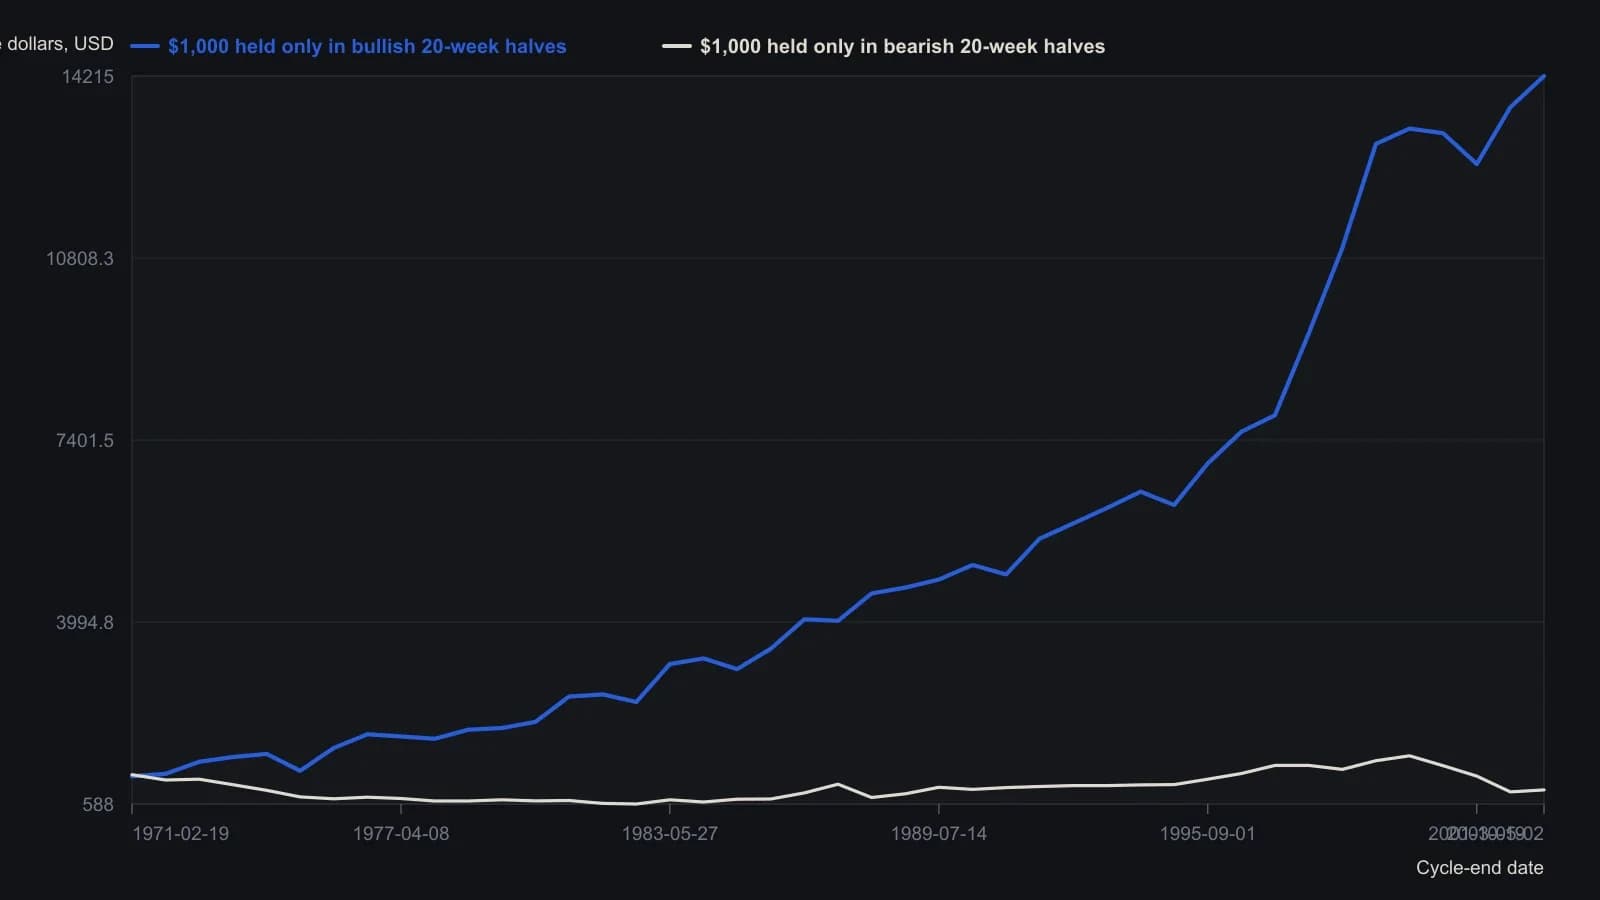
Interval fixed at 280 calendar days from 15 May 1970 before prices were scored. The open cycle that began 2 May 2003 is omitted. Neither series earns interest while sitting out.
Turn the clock into one procedure
The mechanical-trading-system buys the index at the close on each cycle start, holds for 140 calendar days, then earns a stated idle rate until the next cycle start. Hold, exit, and sit-out actions are specified together, so the procedure can be scored as one test.
From 1970 through 2002 that rule finished ahead of the index in 17 of 33 calendar years, so the evaluation does not show a year-by-year win streak. In all nine calendar years when the index itself declined, the same rule finished ahead of buy-and-hold.
A tendency test, not a proof
The author presents the phase-split as a historical tendency test, not as proof that cycles exist or that the pattern must continue.
All readings on this track · 31 readings
- 1982Cycle phase windows for chart signal filters
- 1987Constructing a cycle-scaled trend oscillator
- 1987Constructing a dominant-cycle grid from marked lows
- 1988Cycle lead from staggered exponential averages
- 1988Auditing the forty-month stock-price cycle
- 1989When long-wave dominant cycles cannot be disproved
- 1991Half-cycle average plot shift versus cycle attenuation
- 1991Half-cycle average contact as an amplitude-ratio test
- 1993Building a restoring-pull indicator from cycle frequency and volume
- 1995Regime filters for a dominant long wave
- 1995A cycle-tuned lead filter from bounded oscillators
- 1998Testable cycle rules instead of fear and greed
- 1999Nested Euro cycle timing as one checkable procedure
- 2002Constructing an instantaneous trendline from a dominant cycle
- 2002Half-cycle center of gravity oscillator from moving-average balance
- 2004Testing a locked forty-week cycle with a hold-or-sit-out rule
- 2005Nested timing bands for dominant-cycle confirmation
- 2005Dominant-cycle baselines versus policy-news narratives
- 2006Pairing a dominant-cycle horizon with trend and oscillators
- 2006A dominant-cycle split into a trend filter and residual Relative Strength Index
- 2007Construct a momentum difference from the dominant cycle
- 2007Naive dominant-cycle rules fail without crowd tests
- 2012Constructing a dominant-cycle forecast as a timing window
- 2012Open-parameter construction of dominant-cycle baselines
- 2013Using a second-term election to check a predeclared dominant-cycle forecast
- 2014Constructing a dominant-cycle forecast baseline
- 2014Quotient transform as an early-onset trend filter
- 2014Construct a trough-to-trough cycle map with the Detrended Price Oscillator
- 2015Dominant-cycle alignment before an earnings catalyst
- 2017Causal reverse exponential average for cycle and trend
- 2020Constructing a cycle-plus-trend oscillator from a one-wavelength chord