2002issue C051-3
Half-cycle center of gravity oscillator from moving-average balance
A finite-impulse-response smoother scales a coefficient-weighted sum of prices. Equal weights place the observation-window balance at the midpoint. Triangular weights that favor the newest bar move that balance toward recent prices. The same center-of-gravity arithmetic, with its sign reversed and delayed by one bar, is the half-dominant-cycle oscillator and its trigger line.
- A finite-impulse-response smoother scales the sum of coefficient-times-price products by the sum of the coefficients.
- Identical coefficients leave the observation-window balance at the midpoint. A newest-bar-heavy triangle shifts that balance toward recent prices.
- Measured from the newest bar, the center of gravity shrinks when prices rise and grows when they fall. Reversing the sign keeps the series in phase with the swings.
- The intended observation window is half the dominant cycle. A one-bar delay of the signed series is the trigger line.
Where a moving average sits
In a finite-impulse-response filter the scaled output is the sum of coefficient-times-price products divided by the sum of the coefficients. Those coefficients are the weights along a fixed observation window of ordered prices.
When every coefficient is identical, as in a simple moving average, the window balance sits at the midpoint of the filter length. The newest bar does not own that location. Equal weights hold the balance halfway along the lookback.
Triangular weights and the center of gravity
Triangular weights that assign the newest bar the full window length and older bars successively smaller integers shift the balance toward recent prices relative to an equal-length simple moving average. That coefficient pattern is the weighted moving average in this construction.
The window balance is the sum of each price times one plus its bar offset, divided by the sum of the prices. The added one keeps the newest bar, indexed at zero, inside the product. That location is the center of gravity of the observation window.
Measured from the newest bar, that balance shrinks when prices rise and grows when they fall. Reversing its sign produces a smoothed series that stays in phase with the price swings.
Half the dominant cycle
The intended observation length is half the dominant cycle so the window covers one full one-way cyclic move. The dominant cycle is the prevailing cyclic period used to choose that length.
A window equal to one full dominant cycle leaves half the prices pulling each way, so the balance stays near the middle and the oscillator shows little motion. A window that is too short forgoes the smoothing of a longer average and leaves higher-frequency components in the oscillator.
The worked example uses a 10-bar observation window.
The trigger line
A one-bar delay of the signed series can be plotted against the current value to form a crossover. That delayed series is the trigger line.
US 96H daily closes, September 1995 to 1 March 1996
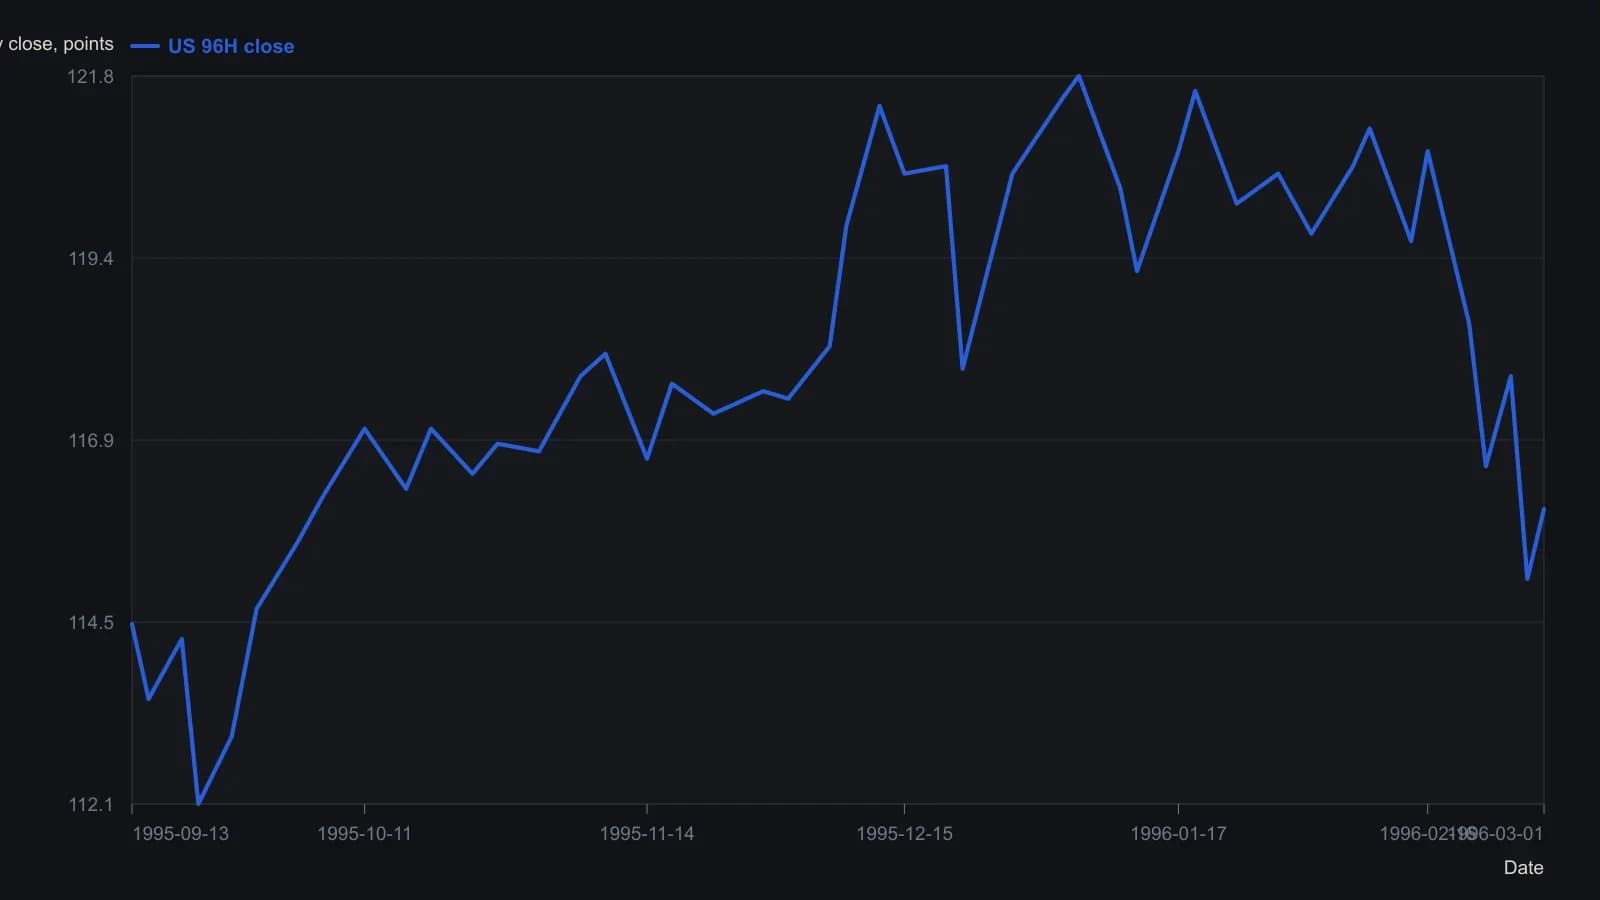
The pane fixes the CG window at 10 bars of (H+L)/2. Dates are interpolated from the month ticks and the 03/01/1996 header. The oscillator trace is too compressed in the raster to recover as a second series.
All readings on this track · 31 readings
- 1982Cycle phase windows for chart signal filters
- 1987Constructing a cycle-scaled trend oscillator
- 1987Constructing a dominant-cycle grid from marked lows
- 1988Cycle lead from staggered exponential averages
- 1988Auditing the forty-month stock-price cycle
- 1989When long-wave dominant cycles cannot be disproved
- 1991Half-cycle average plot shift versus cycle attenuation
- 1991Half-cycle average contact as an amplitude-ratio test
- 1993Building a restoring-pull indicator from cycle frequency and volume
- 1995Regime filters for a dominant long wave
- 1995A cycle-tuned lead filter from bounded oscillators
- 1998Testable cycle rules instead of fear and greed
- 1999Nested Euro cycle timing as one checkable procedure
- 2002Constructing an instantaneous trendline from a dominant cycle
- 2002Half-cycle center of gravity oscillator from moving-average balance
- 2004Testing a locked forty-week cycle with a hold-or-sit-out rule
- 2005Nested timing bands for dominant-cycle confirmation
- 2005Dominant-cycle baselines versus policy-news narratives
- 2006Pairing a dominant-cycle horizon with trend and oscillators
- 2006A dominant-cycle split into a trend filter and residual Relative Strength Index
- 2007Construct a momentum difference from the dominant cycle
- 2007Naive dominant-cycle rules fail without crowd tests
- 2012Constructing a dominant-cycle forecast as a timing window
- 2012Open-parameter construction of dominant-cycle baselines
- 2013Using a second-term election to check a predeclared dominant-cycle forecast
- 2014Constructing a dominant-cycle forecast baseline
- 2014Quotient transform as an early-onset trend filter
- 2014Construct a trough-to-trough cycle map with the Detrended Price Oscillator
- 2015Dominant-cycle alignment before an earnings catalyst
- 2017Causal reverse exponential average for cycle and trend
- 2020Constructing a cycle-plus-trend oscillator from a one-wavelength chord