2015issue C0648-49
Dominant-cycle alignment before an earnings catalyst
One finished 23-month downtrend is used as a classroom for dominant-cycle detection. A measured trough-to-trough-interval and cycle-oscillator-confluence had to be in place before an earnings print could be treated as more than a catalyst.
- The daily dominant-cycle was measured as an average 14-bar trough-to-trough-interval and was used only as confirming evidence of the April 2015 turn.
- Money-flow-divergence on an 89-day histogram, daily keltner-band-reentry, and weekly cycle-oscillator-confluence were already in place at the 22.32 low.
- Catalyst-versus-setup keeps the earnings release as a precipitating event for a reversal that cycle, money-flow, and band readings had already marked as overdue.
- The daily swing map still called for a brief remaining advance into a cycle high, a proportional pullback toward support, and then another advance.
A finished downtrend as the classroom
After a multicycle peak in May 2013 near 48.48, the case-study equity declined for 23 months and printed a low of 22.32 on 2 April 2015.
Editorial reading: that completed decline is the classroom for dominant-cycle detection. The later news print is not allowed to stand in for a measured trough-to-trough-interval or for cycle-oscillator-confluence.
Flow and band evidence at the low
An 89-day money-flow histogram showed money-flow-divergence at two degrees of trend before that April 2015 low. The histogram improved while price continued to make lower levels at more than one trend degree.
On the daily chart, price briefly moved outside the extreme lower Keltner band and then returned inside the band while still drifting lower. That keltner-band-reentry is a return of price inside a volatility envelope after a brief excursion beyond the outer band.
Weekly confluence and the daily dominant-cycle
A weekly Keltner-band reversal coincided with cycle-oscillator-confluence. Four cycle oscillators bottomed and turned higher together on the same weekly bar.
The daily dominant-cycle was measured as an average of 14 bars from trough to trough and was used as confirming evidence of the turn. That trough-to-trough-interval is the bar count from one cycle low to the next and was the daily sampling horizon.
Mattel weekly price through the April 2015 trough
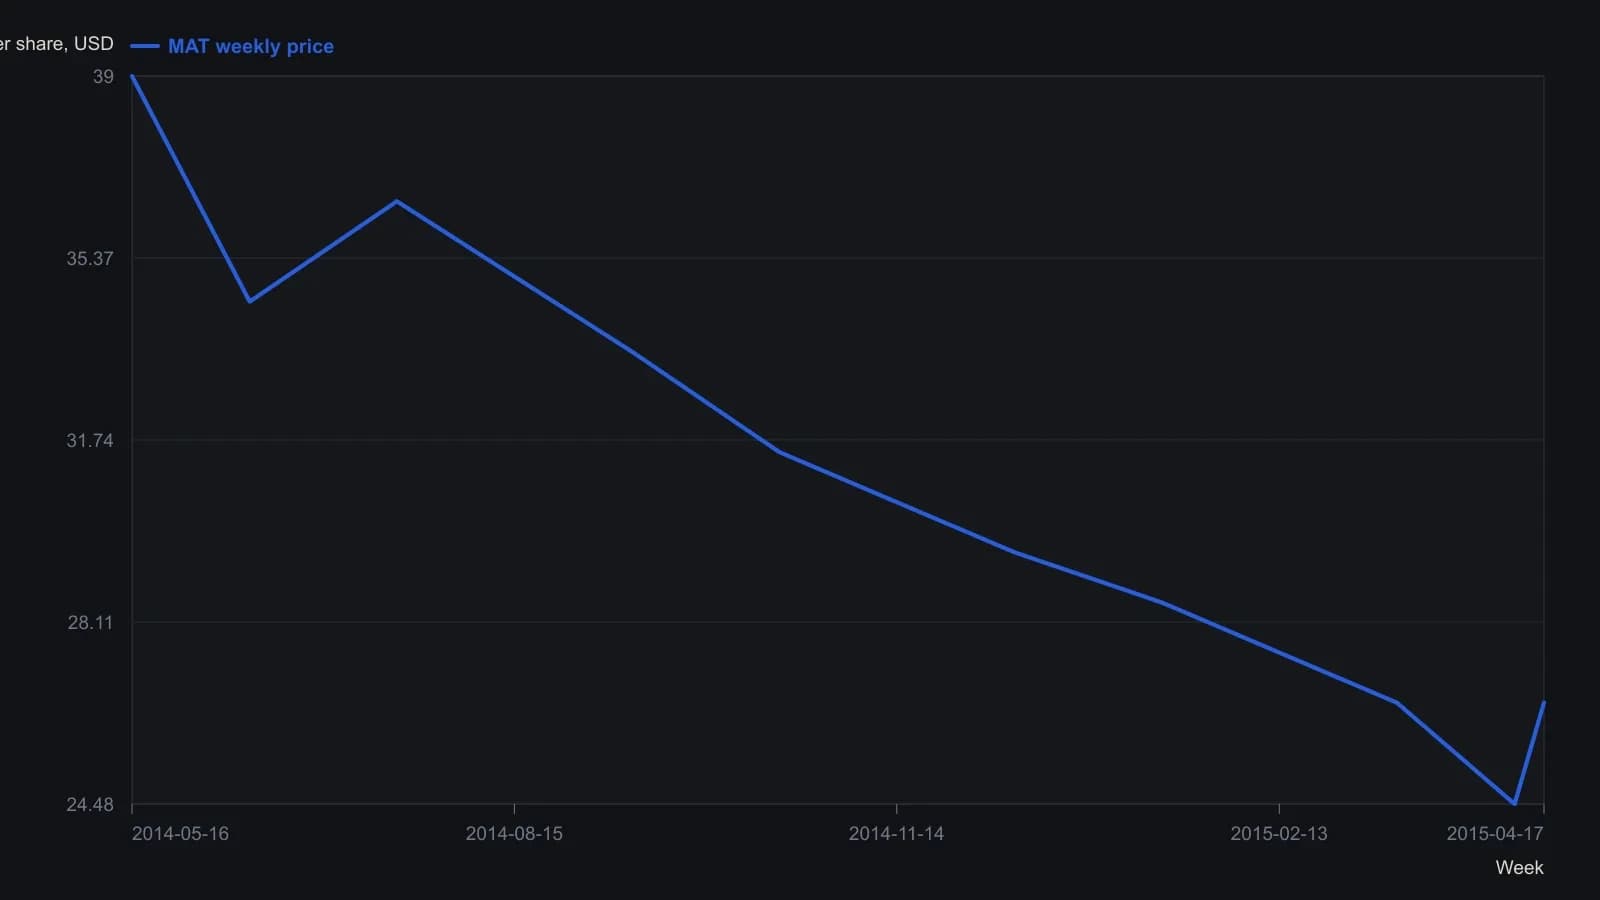
All prices except the printed 24.48 entry are digitized from weekly candles on a raster and are only good to about half a dollar. The pane shows the last year of the 23-month decline, not the May 2013 origin at 48.48.
Catalyst versus setup
On the session when the equity moved above the upper Keltner band, the Dow Jones Industrial Average was down 1.82 percent and a broad S&P 500 proxy was down 1.40 percent.
The earnings release was framed as a precipitating catalyst for a reversal that cycle, money-flow, and band readings had already marked as overdue.
Editorial reading: catalyst-versus-setup is the distinction between a news event that ignites movement and the cycle, flow, and band conditions that already marked a turn as overdue. The archive facts describe that historical workflow. The classroom rule is editorial and is not attributed to the archive.
The mapped path after the turn
The daily swing map called for a brief remaining advance into a cycle high, then a proportional pullback toward support, then another advance. Editorial reading: that path is the forecast content of the dominant-cycle map, not a present-day instruction.
All readings on this track · 31 readings
- 1982Cycle phase windows for chart signal filters
- 1987Constructing a cycle-scaled trend oscillator
- 1987Constructing a dominant-cycle grid from marked lows
- 1988Cycle lead from staggered exponential averages
- 1988Auditing the forty-month stock-price cycle
- 1989When long-wave dominant cycles cannot be disproved
- 1991Half-cycle average plot shift versus cycle attenuation
- 1991Half-cycle average contact as an amplitude-ratio test
- 1993Building a restoring-pull indicator from cycle frequency and volume
- 1995Regime filters for a dominant long wave
- 1995A cycle-tuned lead filter from bounded oscillators
- 1998Testable cycle rules instead of fear and greed
- 1999Nested Euro cycle timing as one checkable procedure
- 2002Constructing an instantaneous trendline from a dominant cycle
- 2002Half-cycle center of gravity oscillator from moving-average balance
- 2004Testing a locked forty-week cycle with a hold-or-sit-out rule
- 2005Nested timing bands for dominant-cycle confirmation
- 2005Dominant-cycle baselines versus policy-news narratives
- 2006Pairing a dominant-cycle horizon with trend and oscillators
- 2006A dominant-cycle split into a trend filter and residual Relative Strength Index
- 2007Construct a momentum difference from the dominant cycle
- 2007Naive dominant-cycle rules fail without crowd tests
- 2012Constructing a dominant-cycle forecast as a timing window
- 2012Open-parameter construction of dominant-cycle baselines
- 2013Using a second-term election to check a predeclared dominant-cycle forecast
- 2014Constructing a dominant-cycle forecast baseline
- 2014Quotient transform as an early-onset trend filter
- 2014Construct a trough-to-trough cycle map with the Detrended Price Oscillator
- 2015Dominant-cycle alignment before an earnings catalyst
- 2017Causal reverse exponential average for cycle and trend
- 2020Constructing a cycle-plus-trend oscillator from a one-wavelength chord