2002issue C021
Constructing an instantaneous trendline from a dominant cycle
An instantaneous-trendline accepts a dominant-cycle length as a construction parameter. A fixed period of 10 sampling intervals can be replaced by a separately computed cycle series inside the same trendline.
- The instantaneous-trendline can be attached to a chart as an external compiled routine rather than rewritten in the charting language.
- With no cycle estimator attached, the dominant-cycle is held fixed at 10 sampling intervals and can later be replaced by a separately computed series.
- A companion smoothed-price series can be assembled from ordinary weighted sums of lagged closes without compiled code.
- A price-versus-line coloring of bars is applied only after a warmup-interval that begins at bar 80.
A cycle length as a construction input
An instantaneous-trendline is a cycle-aware smoother of ordered closes that accepts a dominant-cycle length as a construction parameter. The dominant-cycle is the prevailing oscillatory period, held fixed or estimated from price, that sets the trendline lookback.
The historical workflow attaches that trendline to a chart as an external compiled routine rather than rewriting it inside the charting language.
Holding a period or substituting a series
When no cycle estimator is attached, the construction holds the dominant-cycle fixed at 10 sampling intervals.
A separately computed dominant-cycle series, from an add-on or any other estimator, can replace that fixed period inside the same trendline.
A companion smoothed-price series
A companion smoothed-price series can be assembled from ordinary weighted sums of lagged closes without writing compiled code.
That smoother is four times the current close, plus three times the one-bar lag, plus two times the two-bar lag, plus the three-bar lag, all divided by 10.
A price-versus-line readout after warmup
A charting script can color each bar according to whether the close is above or below the instantaneous-trendline. That price-versus-line check is a bar-level construction readout.
The above-or-below comparison is applied only from bar 80 through the last available bar, so the warmup-interval is the initial run of bars skipped before price is compared with the constructed trendline.
MSFT daily close and Ehlers instantaneous trendline (period 10), 2001
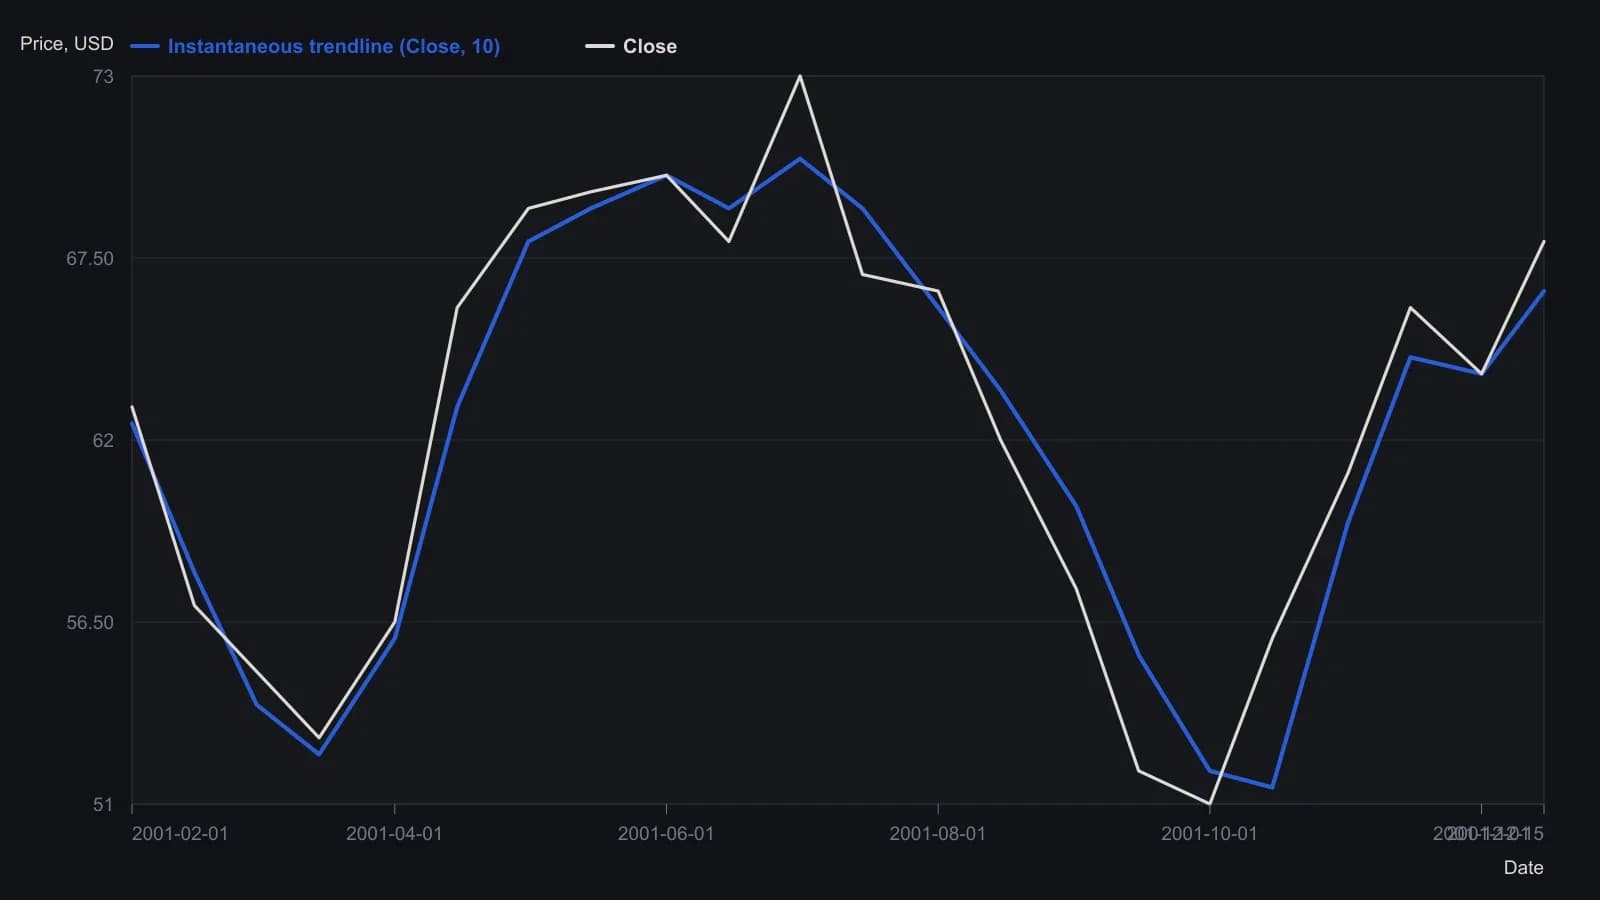
The source chart titles the overlay Ehlers Instantaneous Trendline(Close,10). Default cycle length is the constant 10 used in the NeuroShell tip; y-values are digitized from the printed price scale to the nearest half-dollar.
All readings on this track · 31 readings
- 1982Cycle phase windows for chart signal filters
- 1987Constructing a cycle-scaled trend oscillator
- 1987Constructing a dominant-cycle grid from marked lows
- 1988Cycle lead from staggered exponential averages
- 1988Auditing the forty-month stock-price cycle
- 1989When long-wave dominant cycles cannot be disproved
- 1991Half-cycle average plot shift versus cycle attenuation
- 1991Half-cycle average contact as an amplitude-ratio test
- 1993Building a restoring-pull indicator from cycle frequency and volume
- 1995Regime filters for a dominant long wave
- 1995A cycle-tuned lead filter from bounded oscillators
- 1998Testable cycle rules instead of fear and greed
- 1999Nested Euro cycle timing as one checkable procedure
- 2002Constructing an instantaneous trendline from a dominant cycle
- 2002Half-cycle center of gravity oscillator from moving-average balance
- 2004Testing a locked forty-week cycle with a hold-or-sit-out rule
- 2005Nested timing bands for dominant-cycle confirmation
- 2005Dominant-cycle baselines versus policy-news narratives
- 2006Pairing a dominant-cycle horizon with trend and oscillators
- 2006A dominant-cycle split into a trend filter and residual Relative Strength Index
- 2007Construct a momentum difference from the dominant cycle
- 2007Naive dominant-cycle rules fail without crowd tests
- 2012Constructing a dominant-cycle forecast as a timing window
- 2012Open-parameter construction of dominant-cycle baselines
- 2013Using a second-term election to check a predeclared dominant-cycle forecast
- 2014Constructing a dominant-cycle forecast baseline
- 2014Quotient transform as an early-onset trend filter
- 2014Construct a trough-to-trough cycle map with the Detrended Price Oscillator
- 2015Dominant-cycle alignment before an earnings catalyst
- 2017Causal reverse exponential average for cycle and trend
- 2020Constructing a cycle-plus-trend oscillator from a one-wavelength chord