2017issue C098-12
Causal reverse exponential average for cycle and trend
A one-sided exponential average can run on a live bar, but its group-delay can distort mixed-frequency series. A true backward pass would cancel that phase and cannot be evaluated at the right edge. The archive rebuilds a delayed reverse cascade so one coefficient can steer the same residual toward a trend-filter or a dominant-cycle reading.
- Exponential-smoothing blends the newest observation with the prior average using complementary weights that sum to one, so a constant input settles at the same level.
- Group-delay varies by frequency, so the one-sided average imposes a nonlinear phase map that can distort mixed-frequency market series.
- A backward pass would cancel that phase and double the smoothing, but it is noncausal and cannot be evaluated at the live right edge.
- A delayed causal-reverse-path cascade makes the reverse stage evaluable, and one coefficient steers the residual toward trend-filter or dominant-cycle structure.
The one-sided average on a live bar
An exponential average updates as a weighted mix of the newest observation and the previous average. The weights are complementary and sum to one, so a constant input settles at the same level.
That recursion is exponential-smoothing. It blends the newest observation with the prior output and remains one-sided.
Why phase can distort the waveform
Group-delay varies across frequencies. The one-sided average therefore imposes a nonlinear phase map that can distort the waveform of mixed-frequency market series.
The backward pass is not a live-bar step
Running the same average backward after the full series is available cancels that nonlinear phase and doubles the smoothing. The procedure is noncausal. It cannot be evaluated at the live right edge.
A delayed reverse cascade
Expanding the delay-operator ratio of the exponential recurrence produces an infinite decaying coefficient series. Once later terms become negligible, that series can be cut to a finite-impulse form.
Time-reversing that finite-impulse path and inserting enough delay makes the reverse stage causal. That truncated, delayed reconstruction is the causal-reverse-path. The archive gives a cascade of eight successive modules as sufficient for ordinary market-data error.
One coefficient steers the residual
The published residual subtracts a scaled forward-and-reverse exponential response from a standard exponential average. The subtraction isolates the frequency-phase distortion component.
A single exponential coefficient steers that residual. A value of 0.05 shifts it toward trend structure, the longer-horizon emphasis of a trend-filter. A value of 0.3 shifts it toward cycle structure, the shorter-horizon emphasis of a dominant-cycle reading.
What the finished construction does
The finished construction is causal. It applies extra high-frequency smoothing to limit aliased sampled components. It also applies a low-frequency difference that declines at 6 dB per octave to reduce spectral-dilation.
Reverse EMA residual on daily SPY, July 2016–June 2017
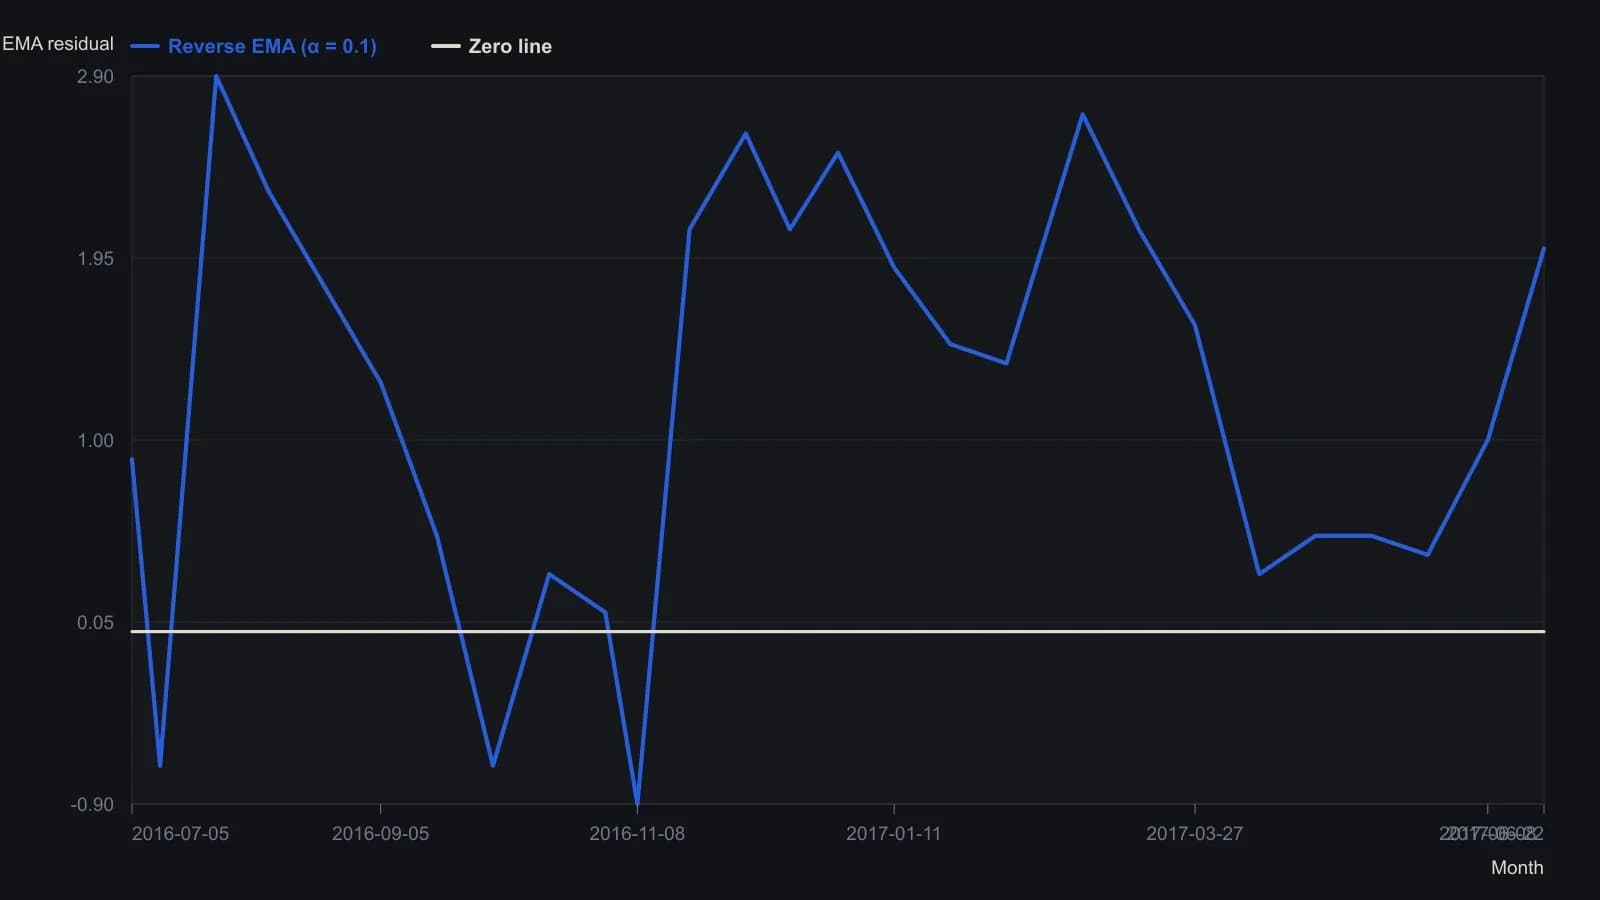
The published figure uses a single alpha of 0.1. The same residual leans toward trend at 0.05 and toward the dominant cycle at 0.3. A magazine raster cannot carry more than about one decimal.
All readings on this track · 31 readings
- 1982Cycle phase windows for chart signal filters
- 1987Constructing a cycle-scaled trend oscillator
- 1987Constructing a dominant-cycle grid from marked lows
- 1988Cycle lead from staggered exponential averages
- 1988Auditing the forty-month stock-price cycle
- 1989When long-wave dominant cycles cannot be disproved
- 1991Half-cycle average plot shift versus cycle attenuation
- 1991Half-cycle average contact as an amplitude-ratio test
- 1993Building a restoring-pull indicator from cycle frequency and volume
- 1995Regime filters for a dominant long wave
- 1995A cycle-tuned lead filter from bounded oscillators
- 1998Testable cycle rules instead of fear and greed
- 1999Nested Euro cycle timing as one checkable procedure
- 2002Constructing an instantaneous trendline from a dominant cycle
- 2002Half-cycle center of gravity oscillator from moving-average balance
- 2004Testing a locked forty-week cycle with a hold-or-sit-out rule
- 2005Nested timing bands for dominant-cycle confirmation
- 2005Dominant-cycle baselines versus policy-news narratives
- 2006Pairing a dominant-cycle horizon with trend and oscillators
- 2006A dominant-cycle split into a trend filter and residual Relative Strength Index
- 2007Construct a momentum difference from the dominant cycle
- 2007Naive dominant-cycle rules fail without crowd tests
- 2012Constructing a dominant-cycle forecast as a timing window
- 2012Open-parameter construction of dominant-cycle baselines
- 2013Using a second-term election to check a predeclared dominant-cycle forecast
- 2014Constructing a dominant-cycle forecast baseline
- 2014Quotient transform as an early-onset trend filter
- 2014Construct a trough-to-trough cycle map with the Detrended Price Oscillator
- 2015Dominant-cycle alignment before an earnings catalyst
- 2017Causal reverse exponential average for cycle and trend
- 2020Constructing a cycle-plus-trend oscillator from a one-wavelength chord